. 2008 Jul 1;413(1):71-80.
doi: 10.1042/BJ20080441.

Specific effects of KChIP3/calsenilin/DREAM, but not KChIPs 1, 2 and 4, on calcium signalling and regulated secretion in PC12 cells

Affiliations

Specific effects of KChIP3/calsenilin/DREAM, but not KChIPs 1, 2 and 4, on calcium signalling and regulated secretion in PC12 cells

Neil Venn et al. Biochem J. .

Abstract

The KChIPs (K+ channel-interacting proteins) are members of the NCS (neuronal calcium sensor) protein family of Ca2+-binding proteins. It is unclear to what extent the KChIPs have distinct functions although they all interact with Kv4 K+ channels. KChIP3 has also been shown to repress transcription of specific genes via binding to DRE (downstream regulatory element) motifs and all KChIPs may share this function. In the present study, we have compared the function of isoforms of the four KChIPs. KChIPs 1-4 were found to stimulate the traffic of Kv4.2 channels to the plasma membrane. KChIP3 expression in PC12 cells resulted in an increase in exocytosis evoked by activation of purinergic receptors. In contrast, KChIPs 1, 2 and 4, although expressed to the same extent, had no effect on secretion. In addition, KChIP3 but not KChIPs 1, 2 and 4 modified the ATP-induced Ca2+ signal resulting in a delay in recovery after the peak Ca2+ elevation and also specifically resulted in down-regulation of the Na+/Ca2+ exchanger NCX3, which could explain the effects on the Ca2+ signal and secretion. Regulation of NCX3 by KChIP3 has been shown to occur via its DREAM (DRE antagonist modulator) function [Gomez-Villafuertes, Torres, Barrio, Savignac, Gabellini, Rizzato, Pintado, Gutierrez-Adan, Mellstrom, Carafoli and Naranjo (2005) J. Neurosci. 25, 10822-10830] suggesting that this activity might depend on the cellular context of expression of the various KChIPs. These results reveal a new role for KChIP3 in the regulation of Ca2+-regulated secretion and also suggest that the functions of each of the KChIPs may be more specialized than previously appreciated.


Figures

Figure 1
Figure 1. Co-expression of KChIPs 1–4 with Kv4.2 in COS-7 cells stimulates traffic of Kv4.2 to the plasma membrane
(A) COS-7 cells were transfected to express KChIPs 1–4 as ECFP-tagged constructs and expression of the proteins was detected by Western blotting with an anti-GFP antibody. (B) COS-7 cells were transfected to express Kv4.2 and 48 h after transfection the cells were fixed and channel localization was detected by immunostaining with an anti-Kv4.2 antibody. (CF) COS-7 cells were transfected to co-express Kv4.2, one of the KChIP–ECFPs, as indicated and channel localization was detected by immunostaining with anti-Kv4.2. The colour overlays show the KChIP–ECFPs in green and Kv4.2 in red, with co-localization seen in yellow. In all cases, traffic of the Kv4.2 to the plasma membrane was evident (arrowheads) along with KChIP localization to the plasma membrane. The scale bar represents 10 μm.
Figure 2
Figure 2. Expression of KChIP–ECFPs in PC12 cells
(A) PC12 cells were transfected to express KChIPs 1–4 as ECFP-tagged constructs and expression of the proteins was detected by Western blotting with an anti-GFP antibody. (B) PC12 cells were transfected to express KChIPs 1–4 as ECFP-tagged constructs and live cells were imaged 48 h after transfection. KChIP1 was localized to punctate structures, whereas KChIP2 was found predominantly on the plasma membrane and KChIPs 3 and 4 appeared to be mainly cytosolic and also present in the nucleus. The scale bar represents 10 μm. (C) The average fluorescence intensity of cells expressing each of the four KChIPs (n=12–18) was determined under identical imaging conditions in order to compare expression levels.
Figure 3
Figure 3. Expression of KChIP3, but none of the other KChIPs, increases stimulated GH release from PC12 cells
(A) PC12 cells were transfected to express GH and each one of the KChIPs as N-terminally FLAG-tagged constructs with the FLAG vector was used as a control. At 2 days after transfection the cells were washed in Krebs–Ringer buffer and incubated with no additions (Basal) or with 300 μM ATP for 15 min. GH release was assayed and expressed as a percentage of the total cellular GH levels (n=4). (B) PC12 cells were transfected to express GH and KChIPs 1 or 3 in pcDNA3 as untagged constructs with the pcDNA vector used as a control. At 2 days after transfection, the cells were washed in Krebs–Ringer buffer and incubated with no additions (Basal) or with 300 μM ATP for 15 min. GH release was assayed and expressed as a percentage of the total cellular GH levels (n=9).
Figure 4
Figure 4. KChIP3–ECFP increases stimulated release of GH in intact cells, but not in response to Ca2+ in permeabilized PC12 cells
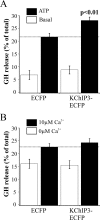
(A) PC12 cells were transfected to express GH and KChIP3–ECFP with the ECFP vector used as a control. At 2 days after transfection, the cells were washed in Krebs–Ringer buffer and incubated with no additions (Basal) or with 300 μM ATP for 15 min. GH release was assayed and expressed as a percentage of the total cellular GH levels (n=12). (B) PC12 cells were transfected to express GH and KChIP3–ECFP with the ECFP vector used as a control. At 2 days after transfection the cells were washed, permeabilized with digitonin and incubated in the presence of 0 or 10 μM free Ca2+ for 15 min. GH release was assayed and expressed as a percentage of the total cellular GH levels (n=6).
Figure 5
Figure 5. Expression of KChIP3, but not KChIPs 1, 2 or 4 delays the decline of intracellular free Ca2+ concentration from the peak after stimulation with ATP
PC12 cells were transfected to express KChIPs 1–4 as ECFP-tagged constructs and 48 h after transfection were loaded with X-rhod-1 AM and then live cells were imaged. An ECFP image was taken to allow identification of transfected and non-transfected cells and then X-rhod-1 fluorescence was monitored before stimulation and after stimulation by perfusion with 300 μM ATP. Images of ECFP and X-rhod-1 before and at the peak after stimulation are shown. After completion of the experiment, average values were collected for whole cell fluorescence for transfected and adjacent control cells. Fluorescence values were normalized to the initial fluorescence for each cell and the results are shown as means±S.E.M. The numbers of cells for each condition were as follows: KChIP1, 19 control and 17 transfected; KChIP2, 35 control and 29 transfected; KChIP3, 19 control and 21 transfected; KChIP4, 22 control and 22 transfected. * Indicates time points at which the values for KChIP3–ECFP-transfected cells were significantly different from control values based on use of a Student's t test with P values less than 0.05.
Figure 6
Figure 6. Expression of presenilin-1–EGFP has no effect on Ca2+ concentration after stimulation with ATP or on GH release from PC12 cells
(A) PC12 cells were transfected to express presenilin-1–EGFP (PS1–EGFP) and 48 h after transfection were loaded with X-rhod-1 AM and then live cells were imaged. An EGFP image was taken to allow identification of transfected and non-transfected cells and then X-rhod-1 fluorescence was monitored before and after stimulation by perfusion with 300 μM ATP. Images of EGFP and X-rhod-1 before stimulation and at the peak after stimulation are shown. After completion of the experiment, average values were collected for whole-cell fluorescence for transfected and adjacent control cells. Fluorescence values were normalized to the initial fluorescence for each cell and the values are shown as means±S.E.M. The numbers of cells for each condition were 28 for control and 26 for transfected conditions. (B) PC12 cells were transfected to express GH and presenilin-1–EGFP (PS1–EGFP) with the ECFP vector used as a control (n=18). At 2 days after transfection, the cells were washed in Krebs–Ringer buffer and incubated with no additions (Basal) or with 300 μM ATP for 15 min. GH release was assayed and expressed as a percentage of the total cellular GH levels. (C) PC12 cells were transfected to express KChIP3 alone (a), presenilin-1–EGFP alone (b) or both proteins (c and c'). (D) PC12 cells were transfected to express GH and KChIP3–ECFP alone or in combination with presenilin-1–EGFP (n=12). At 2 days after transfection, the cells were washed in Krebs–Ringer buffer and incubated with no additions (Basal) or with 300 μM ATP for 15 min. GH release was assayed and expressed as a percentage of the total cellular GH levels.
Figure 7
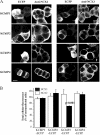
Figure 7. Effect of KChIP expression on the levels of NCX2 and NCX3 Na+/Ca2+ exchangers
(A) PC12 cells were transfected to express KChIP–ECFP constructs as indicated, fixed and stained with anti-NCX2 or NCX3. Microscope fields were examined that contained both transfected cells and non-transfected cells as seen in the ECFP images. Cells transfected with KChIP3–ECFP showing lower NCX3 immunofluorescence levels are indicated by arrows. The scale bar represents 10 μm. (B) Fluorescence levels from transfected and adjacent control non-transfected cells were determined (n=12) and the values for transfected cells were expressed as a percentage of the appropriate controls. *P<0.001 compared with non-transfected control cells.

References

    1. Ikura M., Ames J. B. Genetic polymorphism and protein conformational plasticity in the calmodulin superfamily: two ways to promote multifunctionality. Proc. Natl. Acad. Sci. U.S.A. 2006;103:1159–1164. - PMC - PubMed
    1. Burgoyne R. D. Neuronal calcium sensor proteins: generating diversity in neuronal Ca2+ signalling. Nat. Rev. Neurosci. 2007;8:182–193. - PMC - PubMed
    1. Burgoyne R. D., Weiss J. L. The neuronal calcium sensor family of Ca2+-binding proteins. Biochem. J. 2001;353:1–12. - PMC - PubMed
    1. Palczewski K., Polans A., Baehr W., Ames J. B. Ca2+-binding proteins in the retina: structure, function and the etiology of human visual diseases. BioEssays. 2000;22:337–350. - PubMed
    1. Pruunsild P., Timmusk T. Structure, alternative splicing, and expression of the human and mouse KCNIP gene family. Genomics. 2005;86:581–593. - PubMed

Publication types