

Mapping of small RNAs in the human ENCODE regions
- PMID: 18394580
- PMCID: PMC2427294
- DOI: 10.1016/j.ajhg.2008.02.016
Mapping of small RNAs in the human ENCODE regions
Abstract
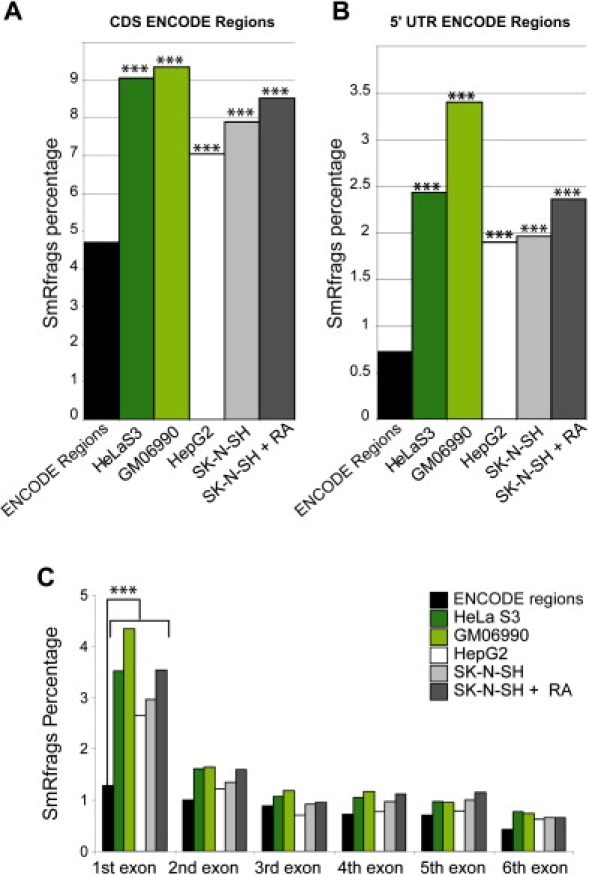
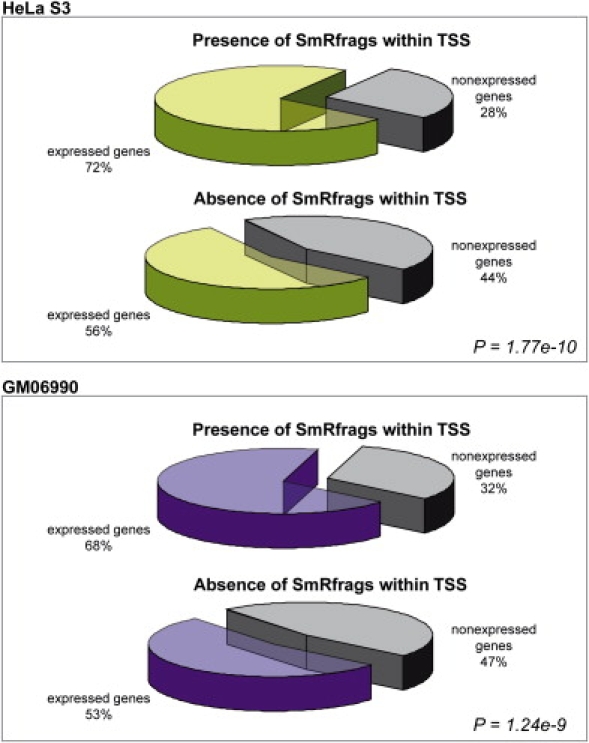
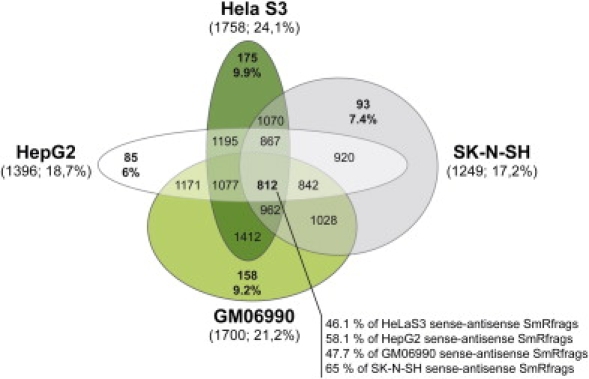
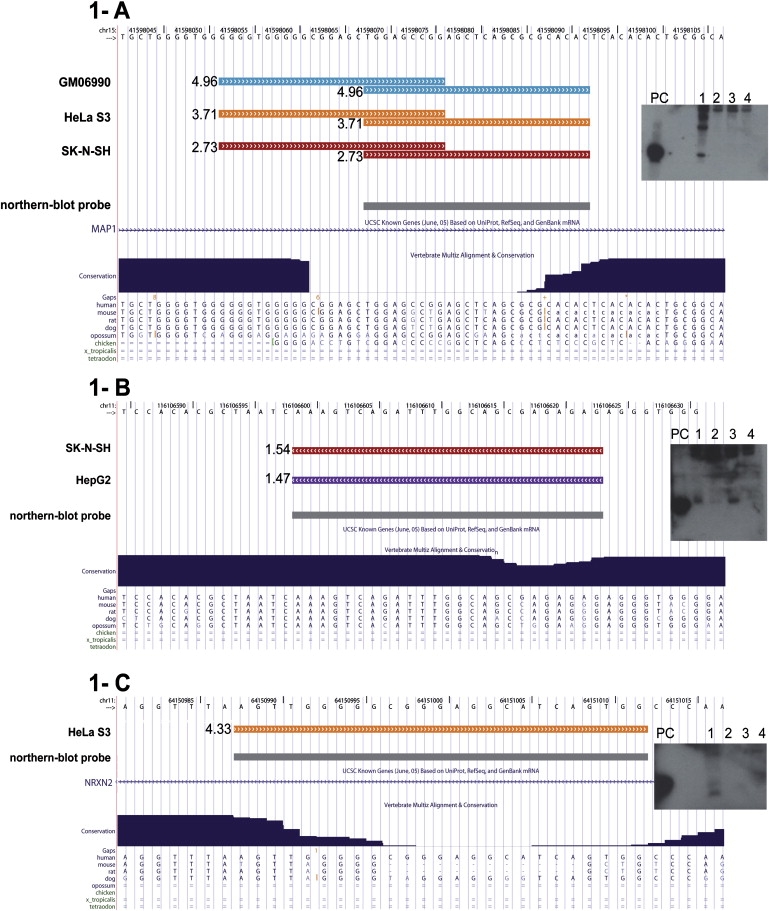
The elucidation of the largely unknown transcriptome of small RNAs is crucial for the understanding of genome and cellular function. We report here the results of the analysis of small RNAs (< 50 nt) in the ENCODE regions of the human genome. Size-fractionated RNAs from four different cell lines (HepG2, HelaS3, GM06990, SK-N-SH) were mapped with the forward and reverse ENCODE high-density resolution tiling arrays. The top 1% of hybridization signals are termed SmRfrags (Small RNA fragments). Eight percent of SmRfrags overlap the GENCODE genes (CDS), given that the majority map to intergenic regions (34%), intronic regions (53%), and untranslated regions (UTRs) (5%). In addition, 9.6% and 16.8% of SmRfrags in the 5' UTR regions overlap significantly with His/Pol II/TAF250 binding sites and DNase I Hypersensitive sites, respectively (compared to the 5.3% and 9% expected). Interestingly, 17%-24% (depending on the cell line) of SmRfrags are sense-antisense strand pairs that show evidence of overlapping transcription. Only 3.4% and 7.2% of SmRfrags in intergenic regions overlap transcribed fragments (Txfrags) in HeLa and GM06990 cell lines, respectively. We hypothesized that a fraction of the identified SmRfrags corresponded to microRNAs. We tested by Northern blot a set of 15 high-likelihood predictions of microRNA candidates that overlap with smRfrags and validated three potential microRNAs ( approximately 20 nt length). Notably, most of the remaining candidates showed a larger hybridizing band ( approximately 100 nt) that could be a microRNA precursor. The small RNA transcriptome is emerging as an important and abundant component of the genome function.
Figures


Similar articles
-
Transcriptional and post-transcriptional profile of human chromosome 21.Genome Res. 2009 Aug;19(8):1471-9. doi: 10.1101/gr.089425.108. Epub 2009 Jul 6. Genome Res. 2009. PMID: 19581486 Free PMC article.
-
Structured RNAs in the ENCODE selected regions of the human genome.Genome Res. 2007 Jun;17(6):852-64. doi: 10.1101/gr.5650707. Genome Res. 2007. PMID: 17568003 Free PMC article.
-
Integrated analysis of experimental data sets reveals many novel promoters in 1% of the human genome.Genome Res. 2007 Jun;17(6):720-31. doi: 10.1101/gr.5716607. Genome Res. 2007. PMID: 17567992 Free PMC article.
-
A high-resolution map of transcription in the yeast genome.Proc Natl Acad Sci U S A. 2006 Apr 4;103(14):5320-5. doi: 10.1073/pnas.0601091103. Epub 2006 Mar 28. Proc Natl Acad Sci U S A. 2006. PMID: 16569694 Free PMC article.
-
In-depth query of large genomes using tiling arrays.Methods Mol Biol. 2007;377:163-74. doi: 10.1007/978-1-59745-390-5_10. Methods Mol Biol. 2007. PMID: 17634616 Review.
Cited by
-
Integrative Analysis of NSCLC Identifies LINC01234 as an Oncogenic lncRNA that Interacts with HNRNPA2B1 and Regulates miR-106b Biogenesis.Mol Ther. 2020 Jun 3;28(6):1479-1493. doi: 10.1016/j.ymthe.2020.03.010. Epub 2020 Mar 19. Mol Ther. 2020. PMID: 32246902 Free PMC article.
-
The association between H3K4me3 and antisense transcription.Genomics Proteomics Bioinformatics. 2012 Apr;10(2):74-81. doi: 10.1016/j.gpb.2012.05.001. Epub 2012 Jun 9. Genomics Proteomics Bioinformatics. 2012. PMID: 22768981 Free PMC article.
-
Reply to Verwilt et al.: Experimental evidence against DNA contamination in SILVER-seq.Proc Natl Acad Sci U S A. 2020 Aug 11;117(32):18937-18938. doi: 10.1073/pnas.2008585117. Proc Natl Acad Sci U S A. 2020. PMID: 32788395 Free PMC article. No abstract available.
-
Human genetics and genomics a decade after the release of the draft sequence of the human genome.Hum Genomics. 2011 Oct;5(6):577-622. doi: 10.1186/1479-7364-5-6-577. Hum Genomics. 2011. PMID: 22155605 Free PMC article. Review.
-
Deeply dissecting stemness: making sense to non-coding RNAs in stem cells.Stem Cell Rev Rep. 2012 Mar;8(1):78-86. doi: 10.1007/s12015-011-9294-y. Stem Cell Rev Rep. 2012. PMID: 21706141 Review.
References
-
- Cheng J., Kapranov P., Drenkow J., Dike S., Brubaker S., Patel S., Long J., Stern D., Tammana H., Helt G. Transcriptional maps of 10 human chromosomes at 5-nucleotide resolution. Science. 2005;308:1149–1154. - PubMed
-
- Kapranov P., Cawley S.E., Drenkow J., Bekiranov S., Strausberg R.L., Fodor S.P., Gingeras T.R. Large-scale transcriptional activity in chromosomes 21 and 22. Science. 2002;296:916–919. - PubMed
-
- Carninci P., Kasukawa T., Katayama S., Gough J., Frith M.C., Maeda N., Oyama R., Ravasi T., Lenhard B., Wells C. The transcriptional landscape of the mammalian genome. Science. 2005;309:1559–1563. - PubMed
-
- Kapranov P., Cheng J., Dike S., Nix D.A., Duttagupta R., Willingham A.T., Stadler P.F., Hertel J., Hackermuller J., Hofacker I.L. RNA maps reveal new RNA classes and a possible function for pervasive transcription. Science. 2007;316:1484–1488. - PubMed
Publication types
MeSH terms
Substances
LinkOut - more resources
Full Text Sources
Research Materials
