

Bayesian meta-analysis of genetic association studies with different sets of markers
- PMID: 18394581
- PMCID: PMC2665011
- DOI: 10.1016/j.ajhg.2008.01.016
Bayesian meta-analysis of genetic association studies with different sets of markers
Abstract
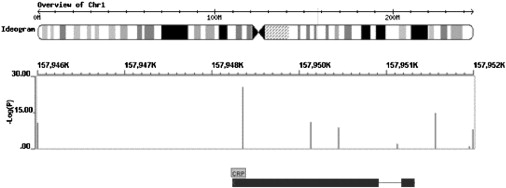
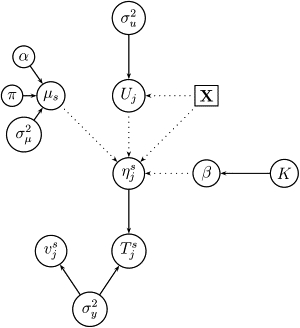
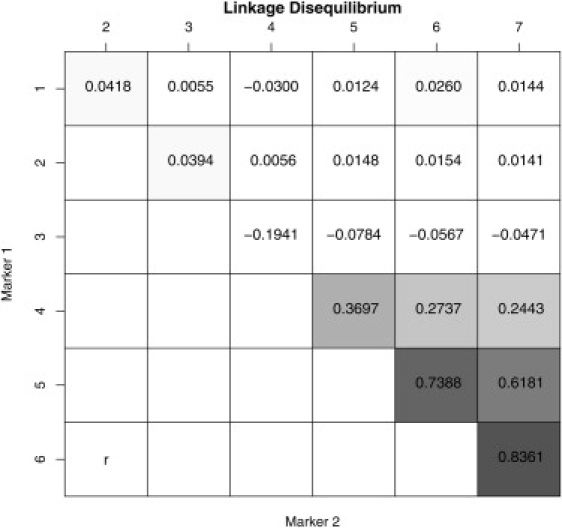
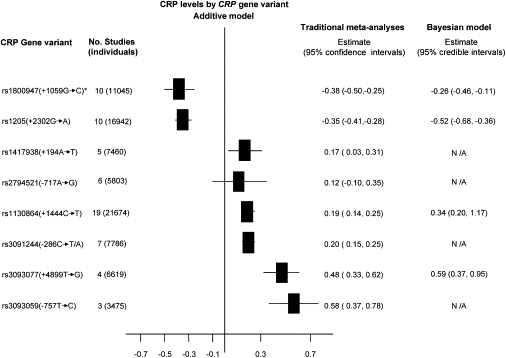
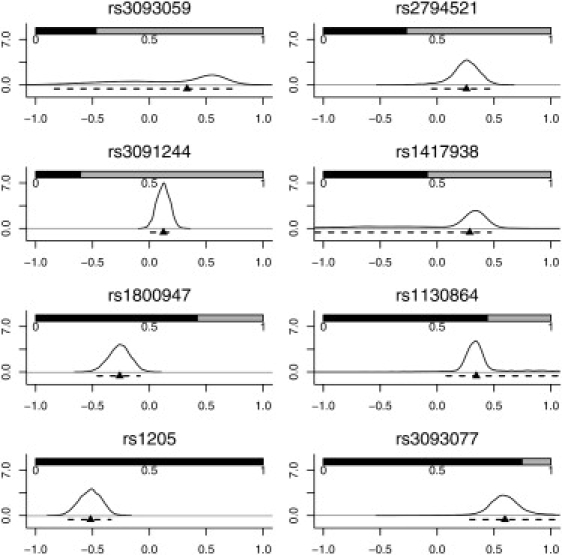
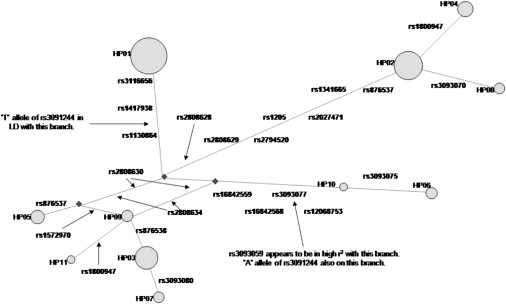
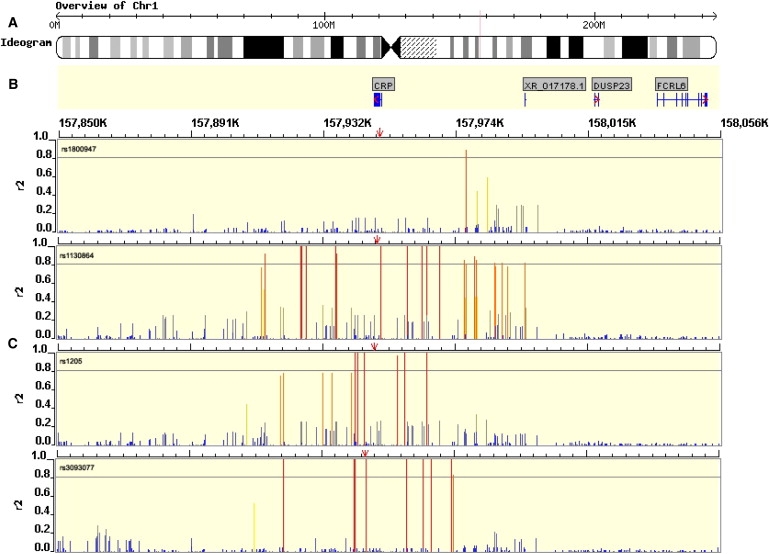
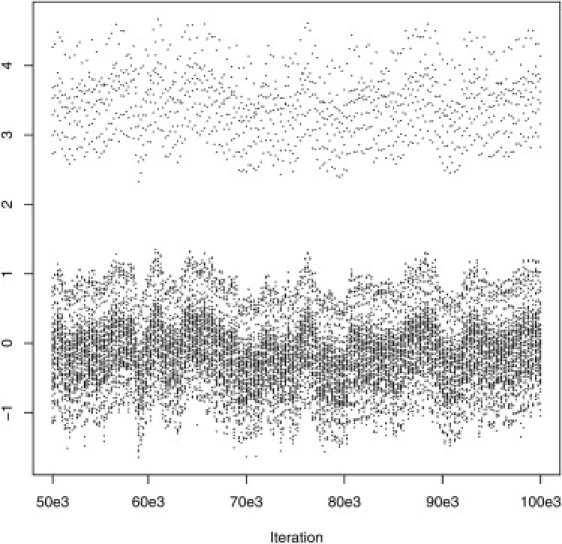
Robust assessment of genetic effects on quantitative traits or complex-disease risk requires synthesis of evidence from multiple studies. Frequently, studies have genotyped partially overlapping sets of SNPs within a gene or region of interest, hampering attempts to combine all the available data. By using the example of C-reactive protein (CRP) as a quantitative trait, we show how linkage disequilibrium in and around its gene facilitates use of Bayesian hierarchical models to integrate informative data from all available genetic association studies of this trait, irrespective of the SNP typed. A variable selection scheme, followed by contextualization of SNPs exhibiting independent associations within the haplotype structure of the gene, enhanced our ability to infer likely causal variants in this region with population-scale data. This strategy, based on data from a literature based systematic review and substantial new genotyping, facilitated the most comprehensive evaluation to date of the role of variants governing CRP levels, providing important information on the minimal subset of SNPs necessary for comprehensive evaluation of the likely causal relevance of elevated CRP levels for coronary-heart-disease risk by Mendelian randomization. The same method could be applied to evidence synthesis of other quantitative traits, whenever the typed SNPs vary among studies, and to assist fine mapping of causal variants.
Figures

Similar articles
-
Contribution of clinical correlates and 13 C-reactive protein gene polymorphisms to interindividual variability in serum C-reactive protein level.Circulation. 2006 Mar 21;113(11):1415-23. doi: 10.1161/CIRCULATIONAHA.105.591271. Epub 2006 Mar 13. Circulation. 2006. PMID: 16534007
-
C-reactive protein (CRP) gene polymorphisms, CRP levels, and risk of incident coronary heart disease in two nested case-control studies.PLoS One. 2008 Jan 2;3(1):e1395. doi: 10.1371/journal.pone.0001395. PLoS One. 2008. PMID: 18167554 Free PMC article.
-
Haplotype-based quantitative trait mapping using a clustering algorithm.BMC Bioinformatics. 2006 May 18;7:258. doi: 10.1186/1471-2105-7-258. BMC Bioinformatics. 2006. PMID: 16709248 Free PMC article.
-
Tag SNP selection for association studies.Genet Epidemiol. 2004 Dec;27(4):365-74. doi: 10.1002/gepi.20028. Genet Epidemiol. 2004. PMID: 15372618 Review.
-
Evaluating associations of haplotypes with traits.Genet Epidemiol. 2004 Dec;27(4):348-64. doi: 10.1002/gepi.20037. Genet Epidemiol. 2004. PMID: 15543638 Review.
Cited by
-
Influence of pentraxin 3 (PTX3) genetic variants on myocardial infarction risk and PTX3 plasma levels.PLoS One. 2012;7(12):e53030. doi: 10.1371/journal.pone.0053030. Epub 2012 Dec 28. PLoS One. 2012. PMID: 23285251 Free PMC article.
-
Prioritizing GWAS results: A review of statistical methods and recommendations for their application.Am J Hum Genet. 2010 Jan;86(1):6-22. doi: 10.1016/j.ajhg.2009.11.017. Am J Hum Genet. 2010. PMID: 20074509 Free PMC article. Review.
-
Fine-mapping the genetic basis of CRP regulation in African Americans: a Bayesian approach.Hum Genet. 2008 Jul;123(6):633-42. doi: 10.1007/s00439-008-0517-5. Epub 2008 May 24. Hum Genet. 2008. PMID: 18500540 Free PMC article.
-
Does high C-reactive protein concentration increase atherosclerosis? The Whitehall II Study.PLoS One. 2008 Aug 20;3(8):e3013. doi: 10.1371/journal.pone.0003013. PLoS One. 2008. PMID: 18714381 Free PMC article.
-
Gene-based tests of association.PLoS Genet. 2011 Jul;7(7):e1002177. doi: 10.1371/journal.pgen.1002177. Epub 2011 Jul 28. PLoS Genet. 2011. PMID: 21829371 Free PMC article.
References
-
- Cardon L., Bell J. Association study designs for complex diseases. Nat. Rev. Genet. 2001;2:91–99. - PubMed
-
- Colhoun H., McKeigue P., Davey Smith G. Problems of reporting genetic associations with complex outcomes. Lancet. 2003;361:865–872. - PubMed
-
- Clayton D., McKeigue P. Epidemiological methods for studying genes and environmental factors in complex diseases. Lancet. 2001;358:1356–1360. - PubMed
-
- Zeggini E., Rayner W., Morris A.P., Hattersley A.T., Walker M., Hitman G.A., Deloukas P., Cardon L.R., McCarthy M.I. An evaluation of hapmap sample size and tagging snp performance in large-scale empirical and simulated data sets. Nat. Genet. 2005;37:1320–1322. - PubMed
-
- Cambon-Thomsen A. Assessing the impact of biobanks. Nat. Genet. 2003;34:25–26. - PubMed
Publication types
MeSH terms
Substances
Grants and funding
- G0601942/MRC_/Medical Research Council/United Kingdom
- G0600580/MRC_/Medical Research Council/United Kingdom
- R01 HL076784/HL/NHLBI NIH HHS/United States
- 082178/WT_/Wellcome Trust/United Kingdom
- AG028321/AG/NIA NIH HHS/United States
- MC_U106179471/MRC_/Medical Research Council/United Kingdom
- N01 HC025195/HL/NHLBI NIH HHS/United States
- G0401527/MRC_/Medical Research Council/United Kingdom
- HL076784/HL/NHLBI NIH HHS/United States
- FS/02/086/14760/BHF_/British Heart Foundation/United Kingdom
- R01 AG028321/AG/NIA NIH HHS/United States
- PG2000/015/BHF_/British Heart Foundation/United Kingdom
- GR076024/PHS HHS/United States
- FS/05/125/BHF_/British Heart Foundation/United Kingdom
- N01-HC 25195/HC/NHLBI NIH HHS/United States
LinkOut - more resources
Full Text Sources
Research Materials
Miscellaneous
