Use of 18O labels to monitor deamidation during protein and peptide sample processing
- PMID: 18394920
- PMCID: PMC3105245
- DOI: 10.1016/j.jasms.2008.02.011
Use of 18O labels to monitor deamidation during protein and peptide sample processing
Abstract
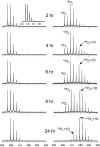
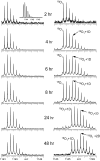
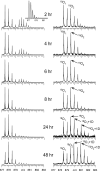
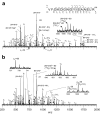
Nonenzymatic deamidation of asparagine residues in proteins generates aspartyl (Asp) and isoaspartyl (isoAsp) residues via a succinimide intermediate in a neutral or basic environment. Electron capture dissociation (ECD) can differentiate and quantify the relative abundance of these isomeric products in the deamidated proteins. This method requires the proteins to be digested, usually by trypsin, into peptides that are amenable to ECD. ECD of these peptides can produce diagnostic ions for each isomer; the c. + 58 and z - 57 fragment ions for the isoAsp residue and the fragment ion ((M + nH)((n-1)+.) - 60) corresponding to the side-chain loss from the Asp residue. However, deamidation can also occur as an artifact during sample preparation, particularly when using typical tryptic digestion protocols. With 18O labeling, it is possible to differentiate deamidation occurring during trypsin digestion which causes a +3 Da (18O1 + 1D) mass shift from the pre-existing deamidation, which leads to a +1-Da mass shift. This paper demonstrates the use of (18)O labeling to monitor three rapidly deamidating peptides released from proteins (calmodulin, ribonuclease A, and lysozyme) during the time course of trypsin digestion processes, and shows that the fast (approximately 4 h) trypsin digestion process generates no additional detectable peptide deamidations.
Figures


Similar articles
-
Detecting deamidation products in proteins by electron capture dissociation.Anal Chem. 2006 Feb 15;78(4):1264-71. doi: 10.1021/ac051691q. Anal Chem. 2006. PMID: 16478121
-
Quantitating the relative abundance of isoaspartyl residues in deamidated proteins by electron capture dissociation.J Am Soc Mass Spectrom. 2007 Jan;18(1):48-56. doi: 10.1016/j.jasms.2006.08.008. Epub 2006 Sep 25. J Am Soc Mass Spectrom. 2007. PMID: 16997569
-
Glutamine deamidation: differentiation of glutamic acid and gamma-glutamic acid in peptides by electron capture dissociation.Anal Chem. 2010 May 1;82(9):3606-15. doi: 10.1021/ac9028467. Anal Chem. 2010. PMID: 20373761 Free PMC article.
-
Quantitative protein analysis using enzymatic [¹⁸O]water labeling.Curr Protoc Protein Sci. 2014 Apr 1;76:23.4.1-23.4.9. doi: 10.1002/0471140864.ps2304s76. Curr Protoc Protein Sci. 2014. PMID: 24692014 Free PMC article. Review.
-
Proteolytic 18O-labeling strategies for quantitative proteomics.Mass Spectrom Rev. 2007 Jan-Feb;26(1):121-36. doi: 10.1002/mas.20116. Mass Spectrom Rev. 2007. PMID: 17086517 Review.
Cited by
-
Structural investigation of a phosphorylation-catalyzed, isoaspartate-free, protein succinimide: crystallographic structure of post-succinimide His15Asp histidine-containing protein.Biochemistry. 2008 Sep 9;47(36):9486-96. doi: 10.1021/bi800847a. Epub 2008 Aug 15. Biochemistry. 2008. PMID: 18702519 Free PMC article.
-
Top-down study of β2-microglobulin deamidation.Anal Chem. 2012 Jul 17;84(14):6150-7. doi: 10.1021/ac3009324. Epub 2012 Jun 29. Anal Chem. 2012. PMID: 22746280 Free PMC article.
-
Evaluation of MALDI-TOF/TOF Mass Spectrometry Approach for Quantitative Determination of Aspartate Residue Isomerization in the Amyloid-β Peptide.J Am Soc Mass Spectrom. 2019 Jul;30(7):1325-1329. doi: 10.1007/s13361-019-02199-2. Epub 2019 May 9. J Am Soc Mass Spectrom. 2019. PMID: 31073890
-
Ionisation bias undermines the use of matrix-assisted laser desorption/ionisation for estimating peptide deamidation: Synthetic peptide studies demonstrate electrospray ionisation gives more reliable response ratios.Rapid Commun Mass Spectrom. 2019 Jun 30;33(12):1049-1057. doi: 10.1002/rcm.8441. Rapid Commun Mass Spectrom. 2019. PMID: 30908787 Free PMC article.
-
Proteomic and systems biology analysis of the monocyte response to Coxiella burnetii infection.PLoS One. 2013 Aug 21;8(8):e69558. doi: 10.1371/journal.pone.0069558. eCollection 2013. PLoS One. 2013. PMID: 23990884 Free PMC article.
References
-
- Robinson NE, Robinson AB. Molecular clocks: Deamidation of asparaginyl and glutaminyl residues in peptides and proteins. Althouse Press; Cave Junction, OR: 2004.
-
- Lindner H, Sarg B, Hoertnagl B, Helliger W. The microheterogeneity of the mammalian H1(0) histone - Evidence for an age-dependent deamidation. J. Biol. Chem. 1998;273:13324–13330. - PubMed
-
- Bischoff R, Kolbe HV. Deamidation of asparagine and glutamine residues in proteins and peptides - structural determinants and analytical methodology. J. Chromatogr. B Biomed. Appl. 1994;662:261–278. - PubMed
Publication types
MeSH terms
Substances
Grants and funding
LinkOut - more resources
Full Text Sources

