. 2008 Apr 4;133(1):53-65.
doi: 10.1016/j.cell.2008.02.042.

RyR1 S-nitrosylation underlies environmental heat stroke and sudden death in Y522S RyR1 knockin mice

Affiliations

RyR1 S-nitrosylation underlies environmental heat stroke and sudden death in Y522S RyR1 knockin mice

William J Durham et al. Cell. .

Abstract

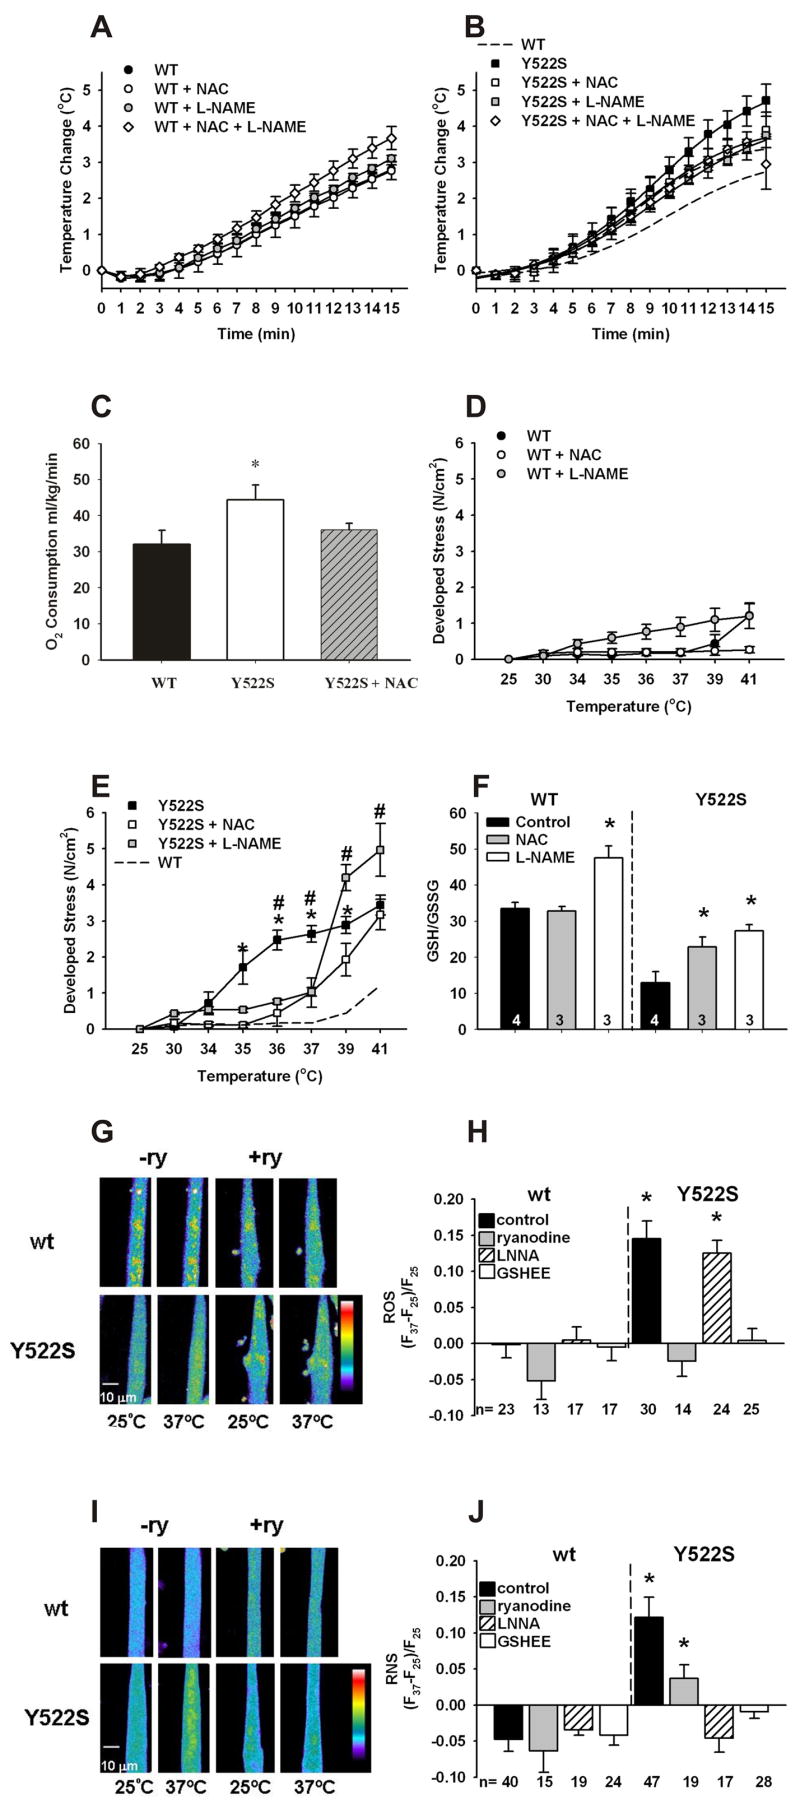
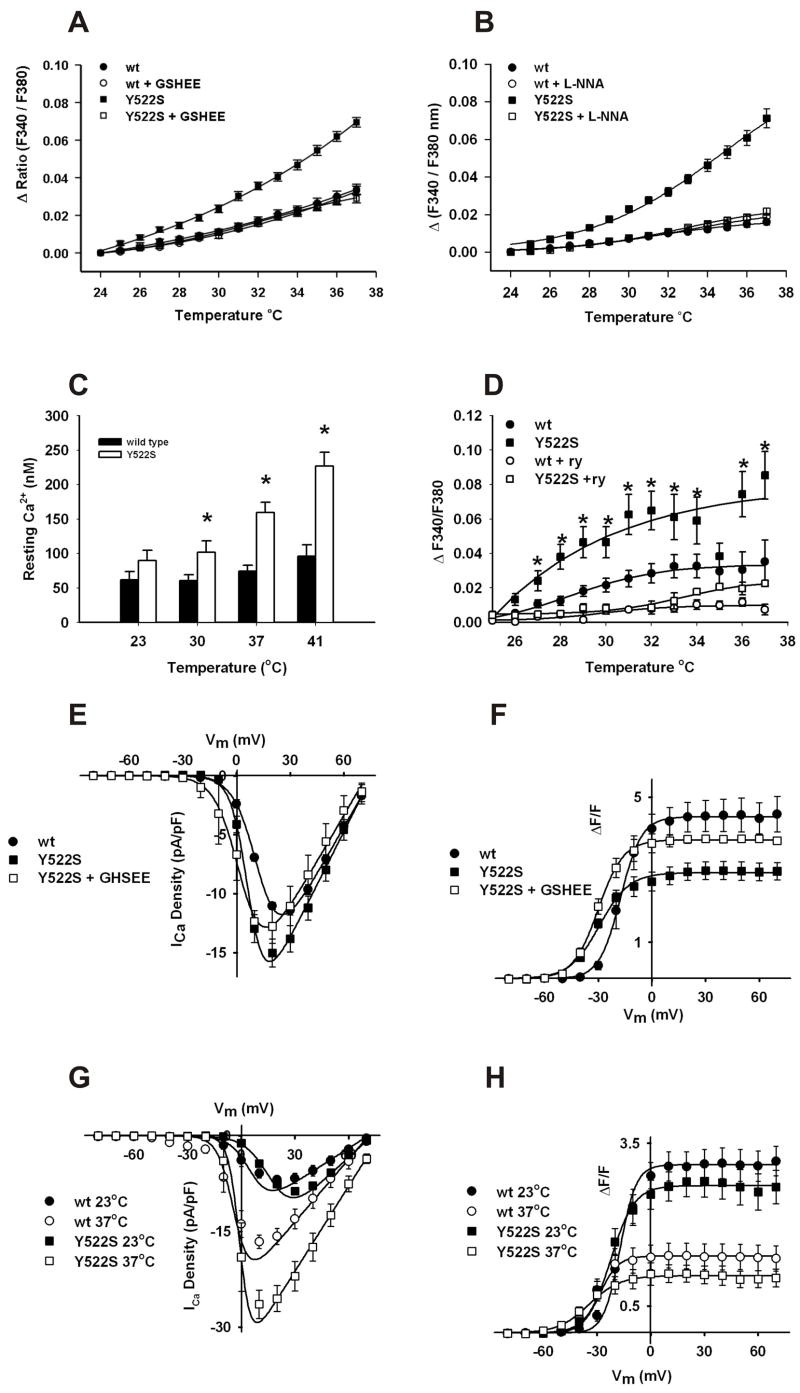
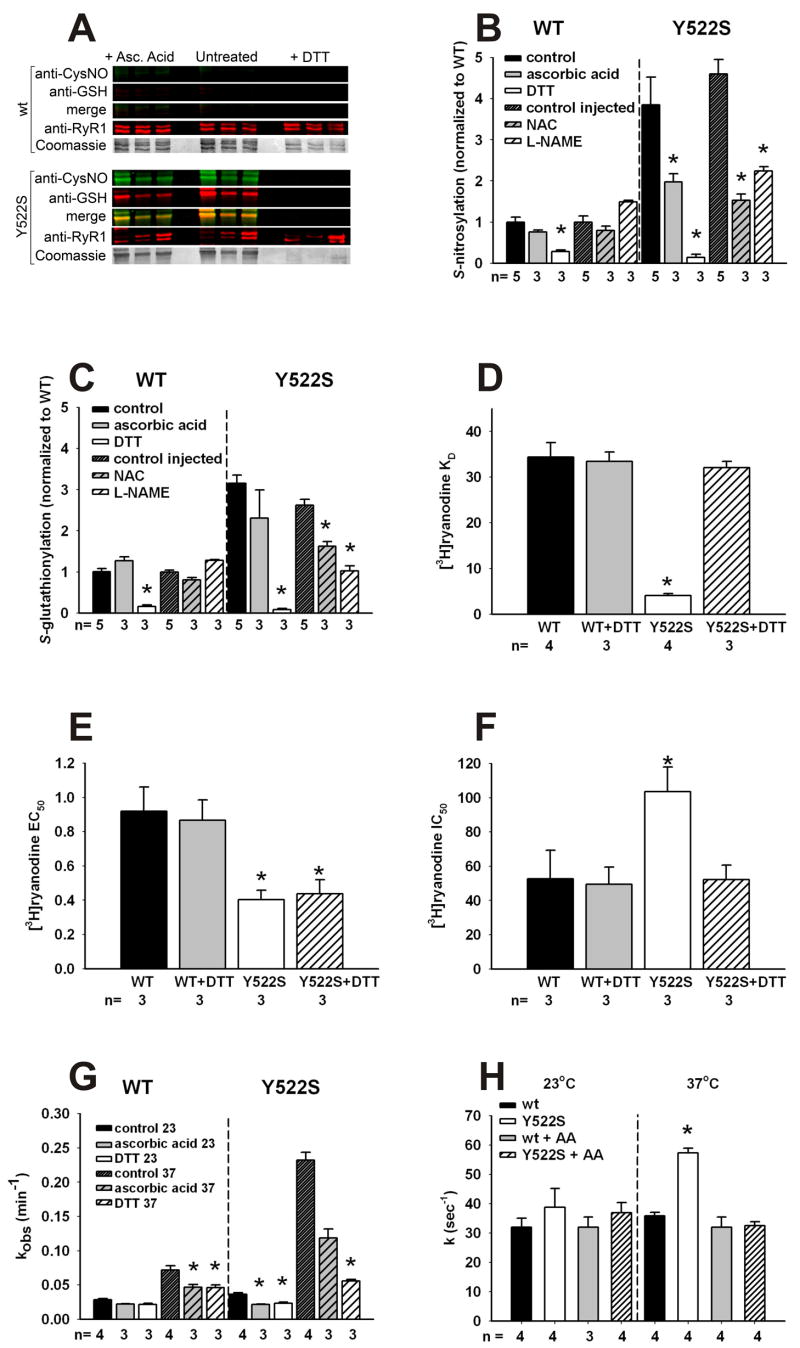
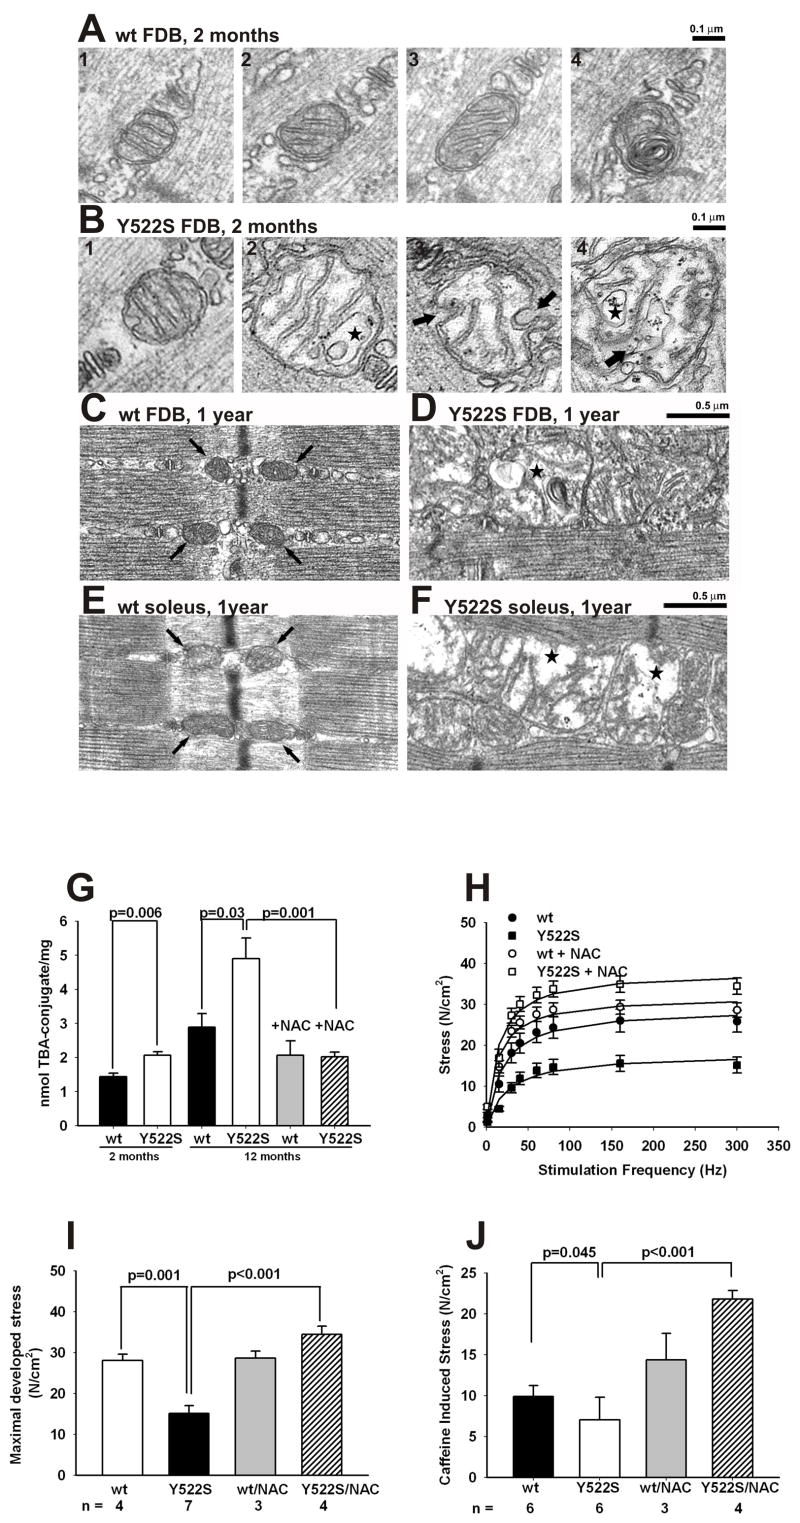
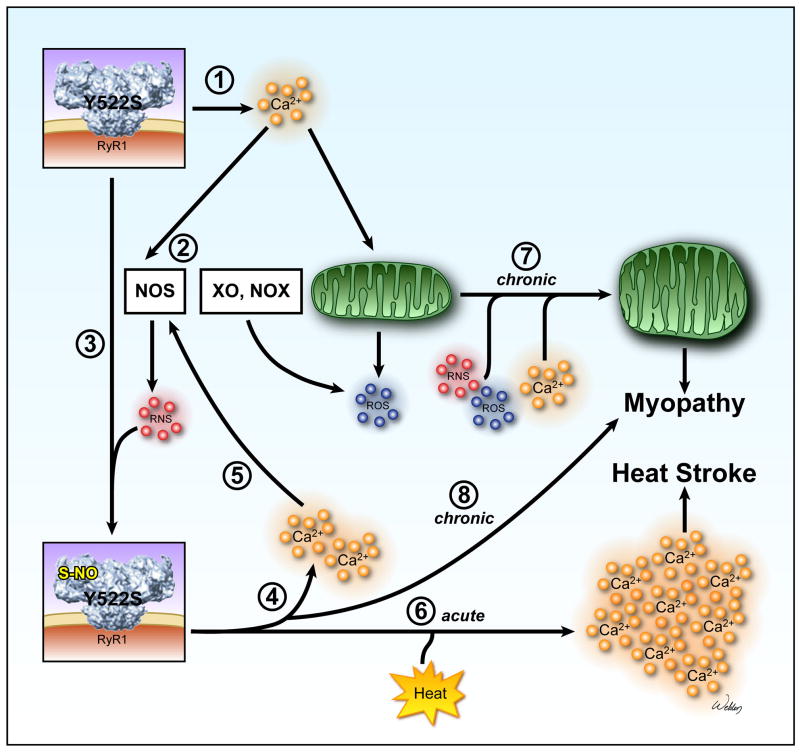
Mice with a malignant hyperthermia mutation (Y522S) in the ryanodine receptor (RyR1) display muscle contractures, rhabdomyolysis, and death in response to elevated environmental temperatures. We demonstrate that this mutation in RyR1 causes Ca(2+) leak, which drives increased generation of reactive nitrogen species (RNS). Subsequent S-nitrosylation of the mutant RyR1 increases its temperature sensitivity for activation, producing muscle contractures upon exposure to elevated temperatures. The Y522S mutation in humans is associated with central core disease. Many mitochondria in the muscle of heterozygous Y522S mice are swollen and misshapen. The mutant muscle displays decreased force production and increased mitochondrial lipid peroxidation with aging. Chronic treatment with N-acetylcysteine protects against mitochondrial oxidative damage and the decline in force generation. We propose a feed-forward cyclic mechanism that increases the temperature sensitivity of RyR1 activation and underlies heat stroke and sudden death. The cycle eventually produces a myopathy with damaged mitochondria.


Figures

Figure 1
Figure 1. Effects of warming on RyR1Y522S/wt mice
A. Rectal temperatures in RyR1wt/wt mice. Mice were anesthetized with etomidate (i.p.) and placed in an environmental chamber (41°C) and rectal temperatures were measured as a function of time in RyR1wt/wt mice (●, n=10) and in mice treated for 3–5 days with NAC (○, n=6), L-NAME (gray circles, n=4) or combined NAC and L-NAME (◇, n=4). B. Rectal temperatures in RyR1Y522S/wt mice. Similar measurements were made with RyR1Y522S/wt mice (■, n=7) and mice treated with NAC (□, n=4), L-NAME (gray squares, n=4), and combined NAC and L-NAME (◇, n=4). The dashed line represents the WT curve from Figure 1A for comparison. When the curves were compared by F-tests, NAC (p<0.05), L-NAME (p<0.001) and NAC + L-NAME (p<0.001) significantly attenuated the response versus no treatment in the RyR1Y522S/wt mice. C. VO2 is increased at thermoneutral conditions in RyR1Y522S/wt mice. VO2 was measured at 32°C using 4–5 mice in each group *p<0.05 vs. RyR1wt/wt. D. Temperature sensitivity of basal stress in RyR1wt/wtsolei. Solei from RyR1wt/wt (with and without prior treatment with NAC or L-NAME) were isolated, attached to force transducers, and heated progressively from an initial temperature of 25°C to 41°C. n=3–8 mice/group. E. Temperature sensitivity of basal stress in RyR1Y522S/wt solei. Group, temperature, and interaction effects were significant (p<0.0001) when data were analyzed by 2-way ANOVA. *p<0.05 to p<0.001 RyR1Y522S/wt vs RyR1Y522S/wt NAC, #p<0.05 to p<0.01 RyR1Y522S/wt vs. RyR1Y522S/wt L-NAME. For clarity, significant differences between L-NAME and NAC treated groups at 39°C and 41°C are not indicated on the graph. F. GSH/GSSG ratios. The data (n=3–4) were compared between untreated mice of each genotype and the mice receiving the indicated treatment. *p<0.05. G. Fluorescence imaging of myotubes loaded with DCF. All imaging data were obtained from multiple cells across at least three independent myotube preparations. Representative images obtained with DCF-loaded RyR1wt/wt and RyR1Y522S/wt myotubes at 25ºC and 37ºC in the presence and absence of ryanodine (20 μM). H. Changes in DCF fluorescence with temperature. ROS production was detected with DCF in the presence absence of ryanodine (20μM), L-NNA (50 μM) and GSHEE (5mM). I. Fluorescence imaging of myotubes loaded with DAF-AM. Representative images obtained with DAF-AM loaded RyR1wt/wt and RyR1Y522S/wt myotubes at 25ºC and 37ºC in the presence and absence of ryanodine (20 μM). J. Changes in DAF fluorescence with temperature. RNS production was detected with DAF in the presence or absence of ryanodine (20μM), L-NNA (50 μM) and GSHEE (5mM). All data in this figure are shown as mean ± S.E.M.
Figure 2
Figure 2. Temperature dependent increases cytosolic Ca2+ levels in RyR1Y522S/wt myotubes and solei
A. Temperature dependent increases in cytosolic Ca2+ levels measured with fura-2. Myotubes loaded with fura-2AM were warmed to the indicated temperatures in the presence and absence of 5mM GSHEE. Values are mean ± SEM for 3 independent cultures for each group: RyR1wt/wt (●, n=27), RyR1wt/wt + GSHEE (○, n=31), RyR1Y522S/wt (■, n=29), RyR1Y522S/wt + GSHEE (□, n=32) (*p < 0.001, one-way ANOVA followed by Scheffe's comparison). B. Effect of L-NNA on temperature dependent increase in resting Ca2+. Myotubes loaded with fura-2AM were warmed to the indicated temperatures in the presence or absence of 50μM L-NNA. RyR1Y522S/wt (■, n= 27) RyR1Y522S/wt + L-NNA (□, n= 31), RyR1wt/wt (●, n= 28) and RyR1wt/wt + L-NNA (○, n= 33). *p<0.05, one way ANOVA followed by Scheffe’s comparison. C. Temperature dependent increases in cytosolic free Ca2+ concentration in RyR1Y522S/wt myotubes. Indo-1-loaded myotubes were warmed to the indicated temperatures and indo-1 ratios were calibrated as described in Methods. *p<0.05 compared to RyR1wt/wt at 23°C. D. Temperature dependent increases in cytosolic Ca2+ in solei fibers. Solei fibers of RyR1Y522S/wt mice were loaded with fura-2 and resting Ca2+ was measured in the presence or absence of ryanodine (20μM). RyR1Y522S/wt (■, n= 17), RyR1Y522S/wt + 20μM ryanodine (□, n=10), RyR1wt/wt (●, n= 12) and RyR1wt/wt + 20μM ryanodine (○, n= 4). *p<0.05, one-way ANOVA. E. Effects of GSHEE on the voltage dependence of L-type Ca2+ currents. Voltage dependence of average (± SEM) peak L-currents at room temperature in RyR1wt/wt myotubes (●), RyR1Y522S/wt myotubes (■), and RyR1Y522S/wt myotubes preincubated with 5 mM GSHEE (□). F. The effects of GSHEE on the voltage dependence of intracellular Ca2+ release. Ca2+ transients at room temperature were measured in RyR1wt/wt myotubes (●), RyR1Y522S/wt myotubes (■), and RyR1Y522S/wt myotubes preincubated with 5 mM GSHEE (□). G. Temperature dependence of L-type Ca2+ currents in RyR1wt/wt and RyR1Y522S/wt myotubes. Voltage dependence of average (± SEM) peak L-currents at 23°C (closed symbols) and 37°C (open symbols) in RyR1wt/wt myotubes (circles) and RyR1Y522S/wt (squares) myotubes. Each dataset was fit (smooth solid lines) using equations described previously (Chelu, 2006) in order to determine Gmax, VG1/2, kG, and Vrev at both 23°C (167 nS/nF, 7.8 mV, 8.6 mV, and 72.6 mV for RyR1wt/wt and 242 nS/nF, 17.3 mV, 7.1 mV, and 73.0 mV for RyR1Y522S/wt, respectively) and 37°C (309 nS/nF, −3.0 mV, 7.0 mV, and 72.5 mV for RyR1wt/wt and 442 nS/nF, −0.6 mV, 4.5 mV, and 78.2 mV for RyR1Y522S/wt, respectively). H. Temperature dependence of intracellular Ca2+ transients in RyR1wt/wt and RyR1Y522S/wt myotubes. Voltage dependence of average (± SEM) peak Ca2+ transient amplitude at 23°C (closed symbols) and 37°C (open symbols) in RyR1wt/wt myotubes (circles) and RyR1Y522S/wt (squares) myotubes Each dataset was fit (smooth solid lines) using equations described previously (Chelu, 2006) in order to determine Fmax, VF1/2, and kF at both 23°C (3.1, −16.8 mV, and 6.2 mV for RyR1wt/wt and 2.7, −23.1 mV, and 7.5 mV for RyR1Y522S/wt, respectively) and 37°C (1.4, −31.8 mV, and 5.7 mV for RyR1wt/wt and 1.0, −35.6 mV, and 8.2 mV for RyR1Y522S/wt, respectively for RyR1Y522S/wt, respectively). All data in this figure are shown as mean ± S.E.M.
Figure 3
Figure 3. Redox modifications of RyR1 and functional consequences
A. Redox modifications of RyR1. Representative blots obtained with 3 independent microsomal preparations were obtained from RyR1wt/wt (top) and RyR1Y522S/wt (bottom) mice. Density of the bands corresponding to the redox modifications of RyR1 were obtained under control conditions (middle) or in the presence of either ascorbic acid (left) or DTT (right). B. Fluorescence signals for S-nitrosylation normalized to the Coomassie stain of each band. Data (mean ± SD, n=3–5) are presented as the ratio to untreated microsomes. *p<0.05 compared to control. C. Fluorescence signals for S-glutathionylation normalized to the Coomassie stain of each band. Data (mean ± SD, n=3–5) are presented as the ratio to untreated microsomes. *p<0.05 compared to control. D–F. Equilibrium [3H]ryanodine binding. Scatchard plot analysis (see Supplemental Figure 4) determination of KD values for [3H]ryanodine binding to microsomes from RyR1wt/wt and RyR1Y522S/wt muscle (D). [3H]ryanodine binding was titrated at different Ca2+concentrations to calculate EC50 (E) and IC50 (F) values from traces as those shown in Supplemental Figure 5. *p<0.05 compared to RyR1wt/wt or untreated controls. G. Temperature dependence of the association kinetics of [3H]ryanodine binding. Microsomes from untreated mice were pre-incubated in vitro with buffer (untreated), AA or DTT as in (A). [3H]ryanodine binding was assessed at different time points (1–90min) and kobs values (mean ± SD) were determined from 3–4 independent experiments. Statistical significance for all panels was obtained by two-way ANOVA. *p<0.05 compared to RyR1wt/wt or untreated controls. H. Rate of Ca2+ efflux from SR vesicles. Ca2+-induced Ca2+ release in the presence of 1mM free ATP and 9–10 μM free Ca2+ was measured using stopped-flow spectrofluorometry. Ca2+ release was measured in RyR1wt/wt and RyR1Y522S/wt vesicles using extravesicular Calcium Green-5N under control conditions or following treatment with AA. Release rate constant values (k) were obtained by peak differential analysis of fluorescence data (representative traces shown in Supplemental Figure 7). All data in this figure are shown as mean ± S.E.M.
Figure 4
Figure 4. Effects of the Y522S mutation on mitochondrial structure and muscle function
A–F. Mitochondrial ultrastructure is altered in muscle of RyR1Y522S/wt mice. A. Mitochondria of RyR1wt/wt fibers at 2–3 months of age are usually regularly shaped, appearing either round (panels 1 and 2) or slightly elongated (panel 3), with a dark/dense internal matrix. Abnormal mitochondria (panel 4) are rare in RyR1wt/wt fibers. B. In RyR1Y522S/wt fibers, some normal mitochondria are present (panel 1), but abnormal mitochondria are frequent (panels 2–4). C–F. At 1 year, a much larger percentage of mitochondria are severely swollen/disrupted than at 2–3 months of age in both in FDB and soleus muscles from RyR1Y522S/wt mice (D and F, stars). In wt FDB (C) and soleus (E) muscles, on the other hand, mitochondria appear similar to those at 2–3 month of age. G. Mitochondrial lipid peroxidation in young and aged mice. Mitochondrial enriched fractions from 2 or 12 month-old mice with or without chronic NAC-treatment (≥ 2 months) were isolated and TBARS were measured in acid supernatants after protein precipitation, as detailed in Methods. Shown are the mean of 3 independent determinations ± SD. H–J. Effect of chronic NAC treatment on skeletal muscle function of aged mice. One year old male RyR1wt/wt and RyR1Y522S/wt mice were treated with NAC (1% w/v) in their drinking water for at least 2 months prior to sacrifice. Solei were removed and stimulated in vitro, as described in Experimental Procedures. Shown are data for stress developed at increasing frequency of electrical stimulation (H) and the maximal tension per cross-sectional area obtained by maximal electrical stimulation (I) or application of 20mM caffeine (J). All data in this figure are shown as mean ± S.E.M.
Figure 5
Figure 5. Proposed model of exertional/environmental heat stress and myopathy in RyR1Y522S/wt mice
➀ SR Ca2+ release channels in RyR1Y522S/wt mice are more sensitive to voltage, ligand, and Ca2+ activation and open more readily, producing small, possibly local, increases in resting Ca2+. ➁ Increased cytosolic Ca2+ levels enhance ROS/RNS production. Increases in RNS are likely to be produced by nitric oxide synthases (NOS). Possible sources of ROS include mitochondria, xanthine oxidase (XO) and NAD(P)H oxidases (NOX). ➂ Although both S-glutathionylation and S-nitrosylation of RyR1Y522S/wt occurs, our data suggest that S-nitrosylation alone enhances the temperature sensitivity of RyR1. ➃ S-nitrosylation of RyR1Y522S/wt increases its sensitivity to temperature and decreases its sensitivity to Ca2+ inhibition further promoting SR Ca2+ leak. ➄ Ca2+ increases further enhance ROS/RNS production. ➅ In response to heat stress, Ca2+ release from the modified RyR1Y522S/wt is greatly and persistently augmented, leading to heat stroke. ➆ and ➇ Chronically-elevated levels of Ca2+ and ROS/RNS damage mitochondria and contribute to the development of myopathy.

Comment in

  • A SNO storm in skeletal muscle.
    Stamler JS, Sun QA, Hess DT. Stamler JS, et al. Cell. 2008 Apr 4;133(1):33-5. doi: 10.1016/j.cell.2008.03.013. Cell. 2008. PMID: 18394987

References

    1. Aghdasi B, Reid MB, Hamilton SL. Nitric Oxide Protects the Skeletal Muscle Ca2+ Release Channel from Oxidation Induced Activation. The Journal of biological chemistry. 1997;272:25462–25467. - PubMed
    1. Aracena-Parks P, Goonasekera SA, Gilman CP, Dirksen RT, Hidalgo C, Hamilton SL. Identification of Cysteines Involved in S-Nitrosylation, S-Glutathionylation, and Oxidation to Disulfides in Ryanodine Receptor Type 1. The Journal of biological chemistry. 2006;281:40354–40368. - PubMed
    1. Barouch LA, Harrison RW, Skaf MW, Rosas GO, Cappola TP, Kobeissi ZA, Hobai IA, Lemmon CA, Burnett AL, O'Rourke B, Rodriguez ER, Huang PL, Lima JA, Berkowitz DE, Hare JM. Nitric Oxide Regulates the Heart by Spatial Confinement of Nitric Oxide Synthase Isoforms. Nature. 2002;416:337–339. - PubMed
    1. Bellinger AM, Reiken S, Dura M, Murphy PW, Deng SX, Landry DW, Nieman D, Lehnart SE, Samaru M, Lacampagne A, Marks AR. Remodeling of Ryanodine Receptor Complex Causes “Leaky” Channels: A Molecular Mechanism for Decreased Exercise Capacity. Proceedings of the National Academy of Sciences of the United States of America.2008. - PMC - PubMed
    1. Bendahan D, Kozak-Ribbens G, Confort-Gouny S, Ghattas B, Figarella-Branger D, Aubert M, Cozzone PJ. A Noninvasive Investigation of Muscle Energetics Supports Similarities Between Exertional Heat Stroke and Malignant Hyperthermia. Anesth Analg. 2001;93:683–689. - PubMed

Publication types

Substances