

Rapid synthesis of auxin via a new tryptophan-dependent pathway is required for shade avoidance in plants
- PMID: 18394996
- PMCID: PMC2442466
- DOI: 10.1016/j.cell.2008.01.049
Rapid synthesis of auxin via a new tryptophan-dependent pathway is required for shade avoidance in plants
Abstract
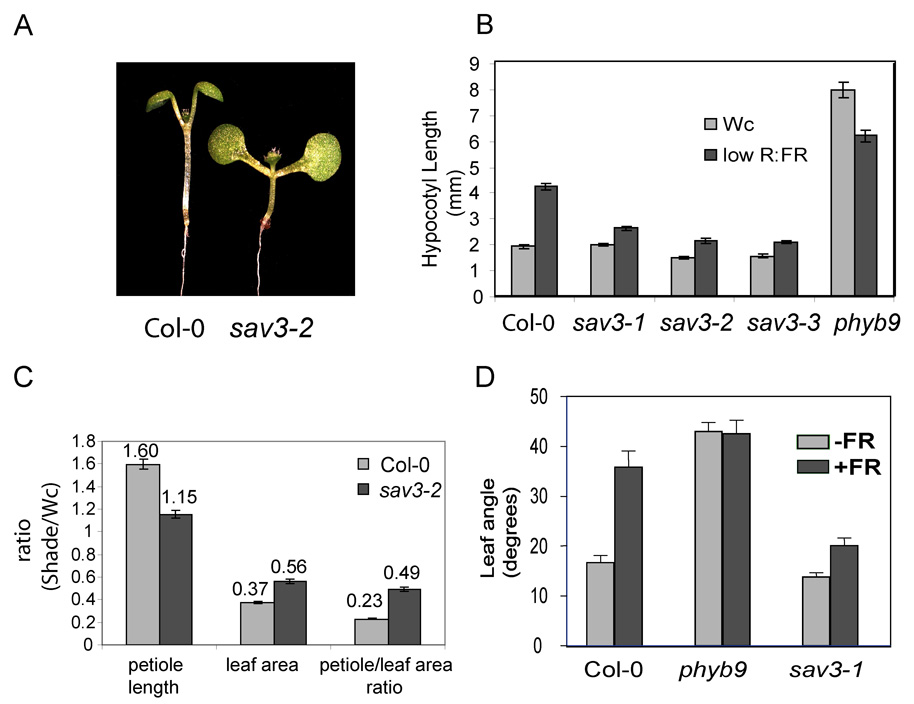
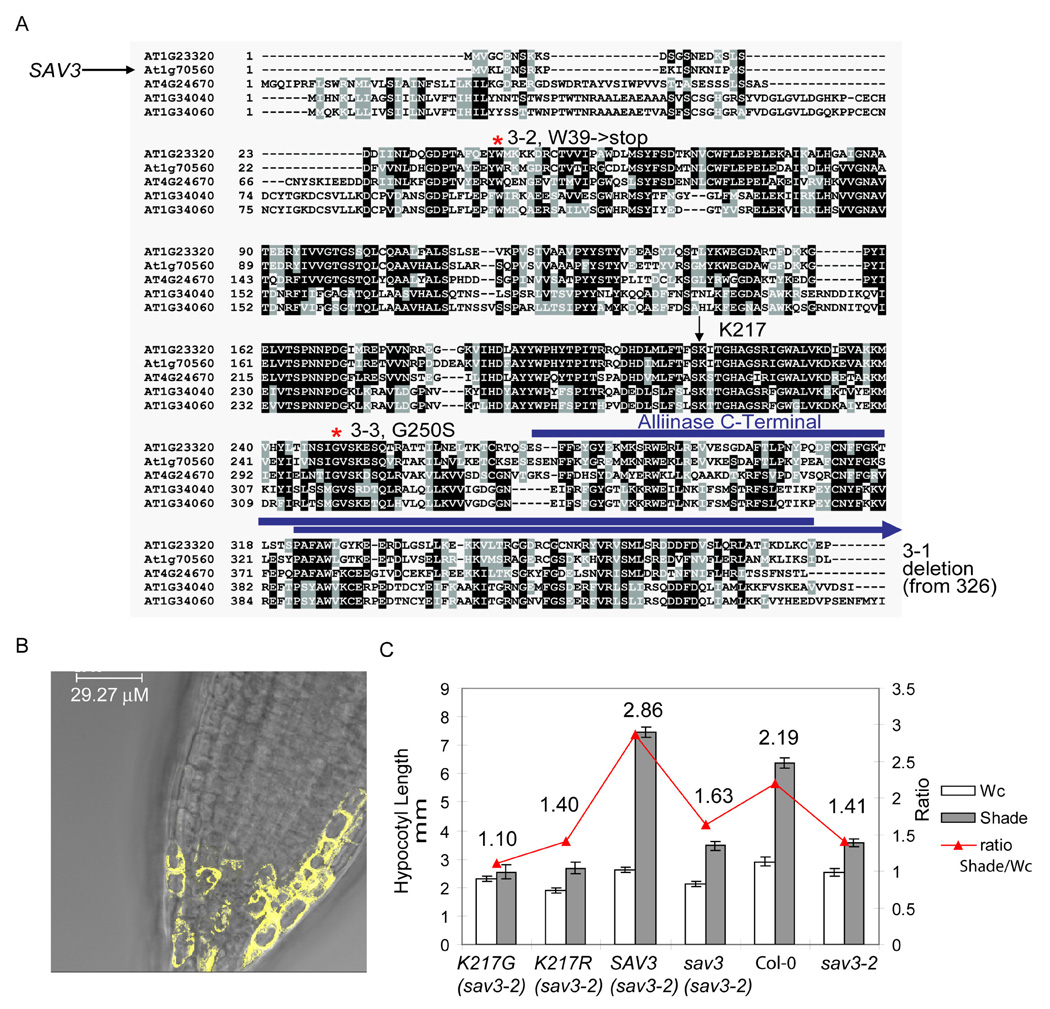
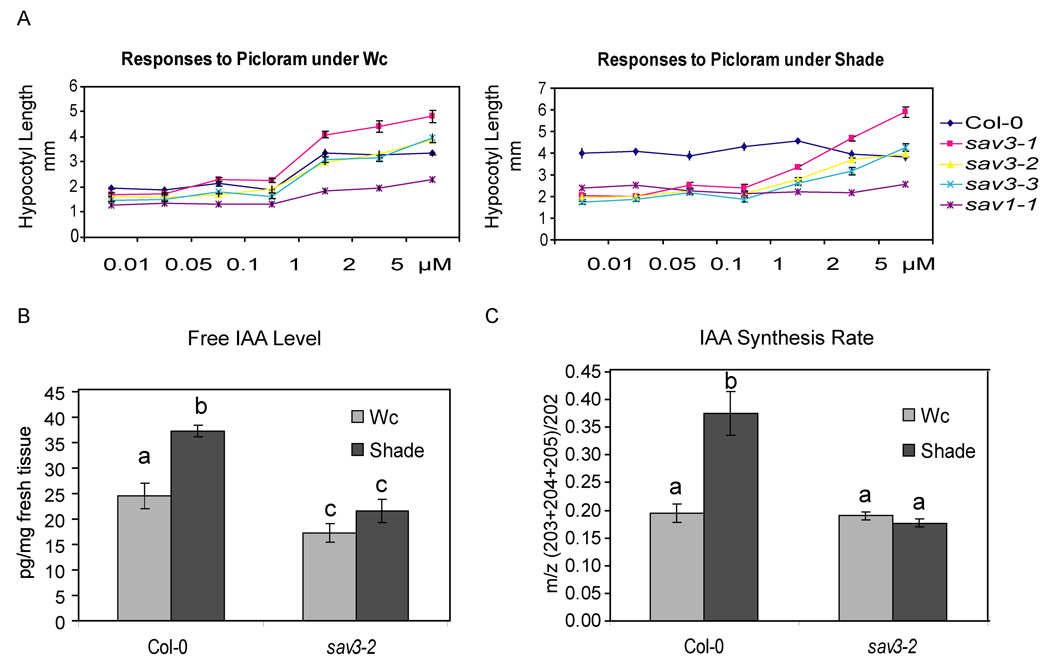
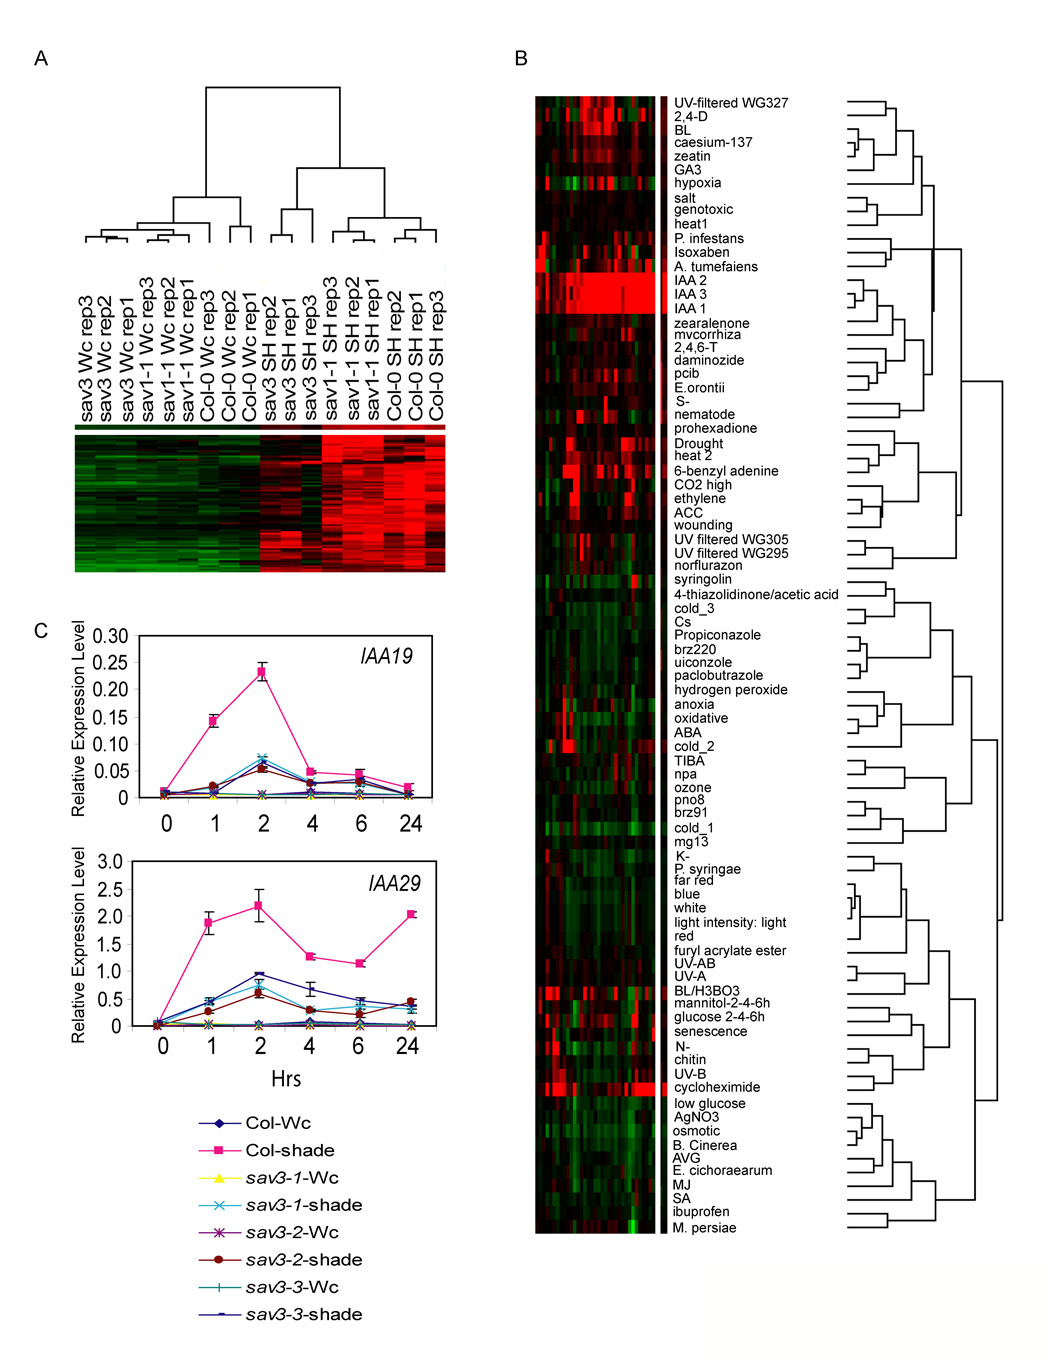
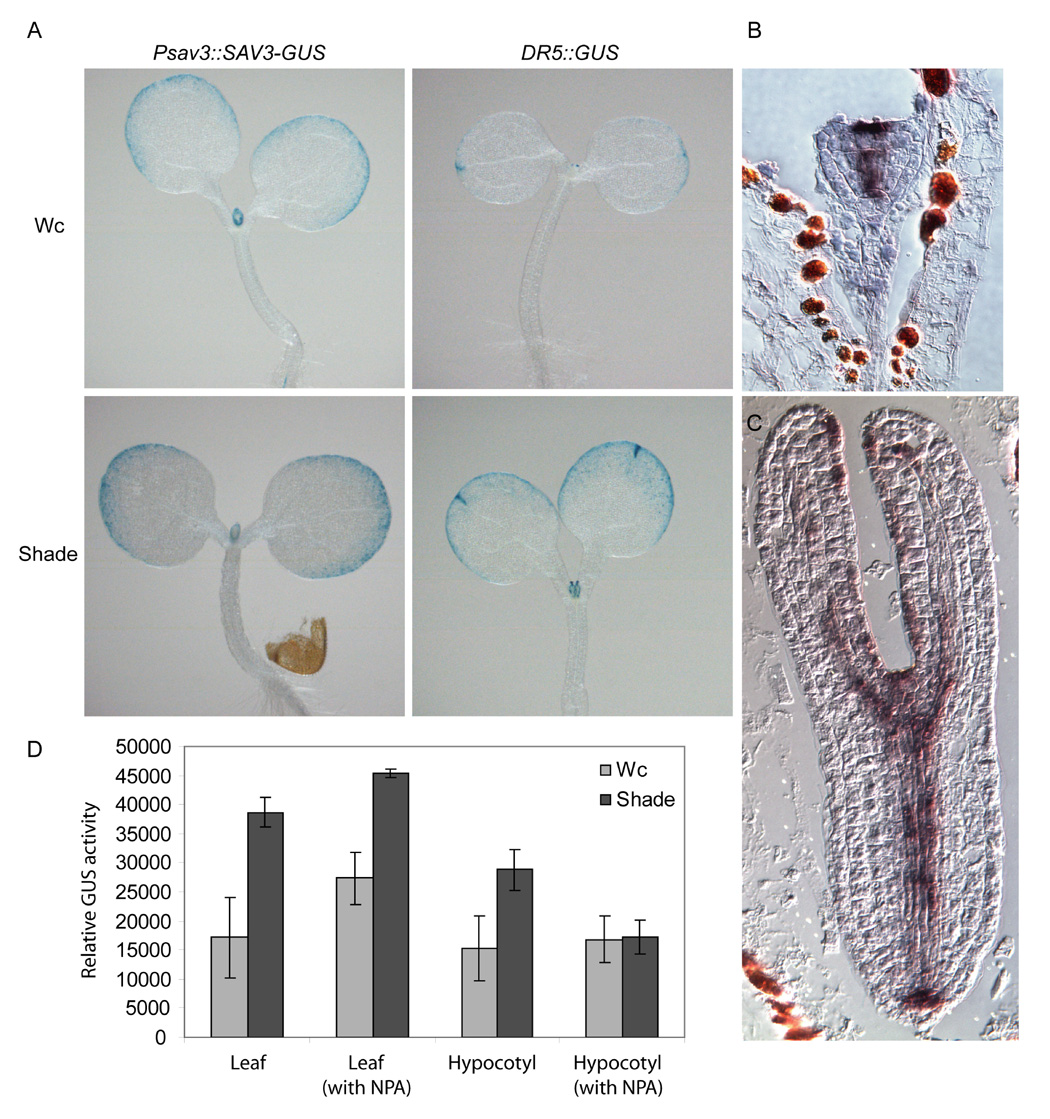
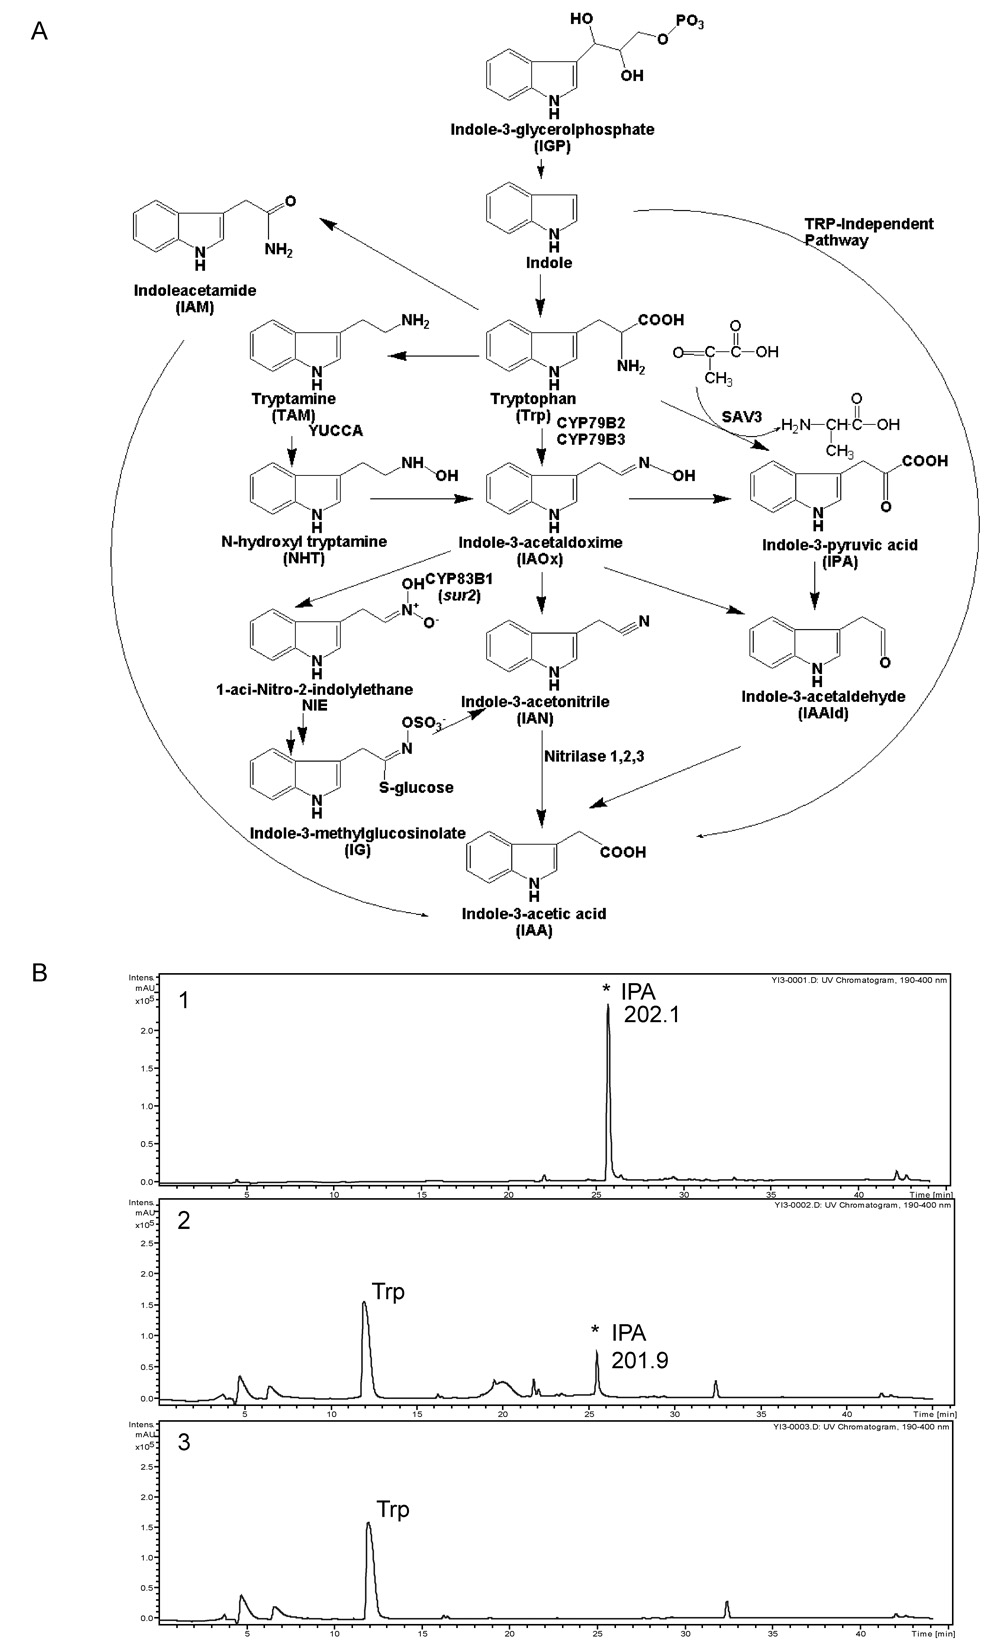
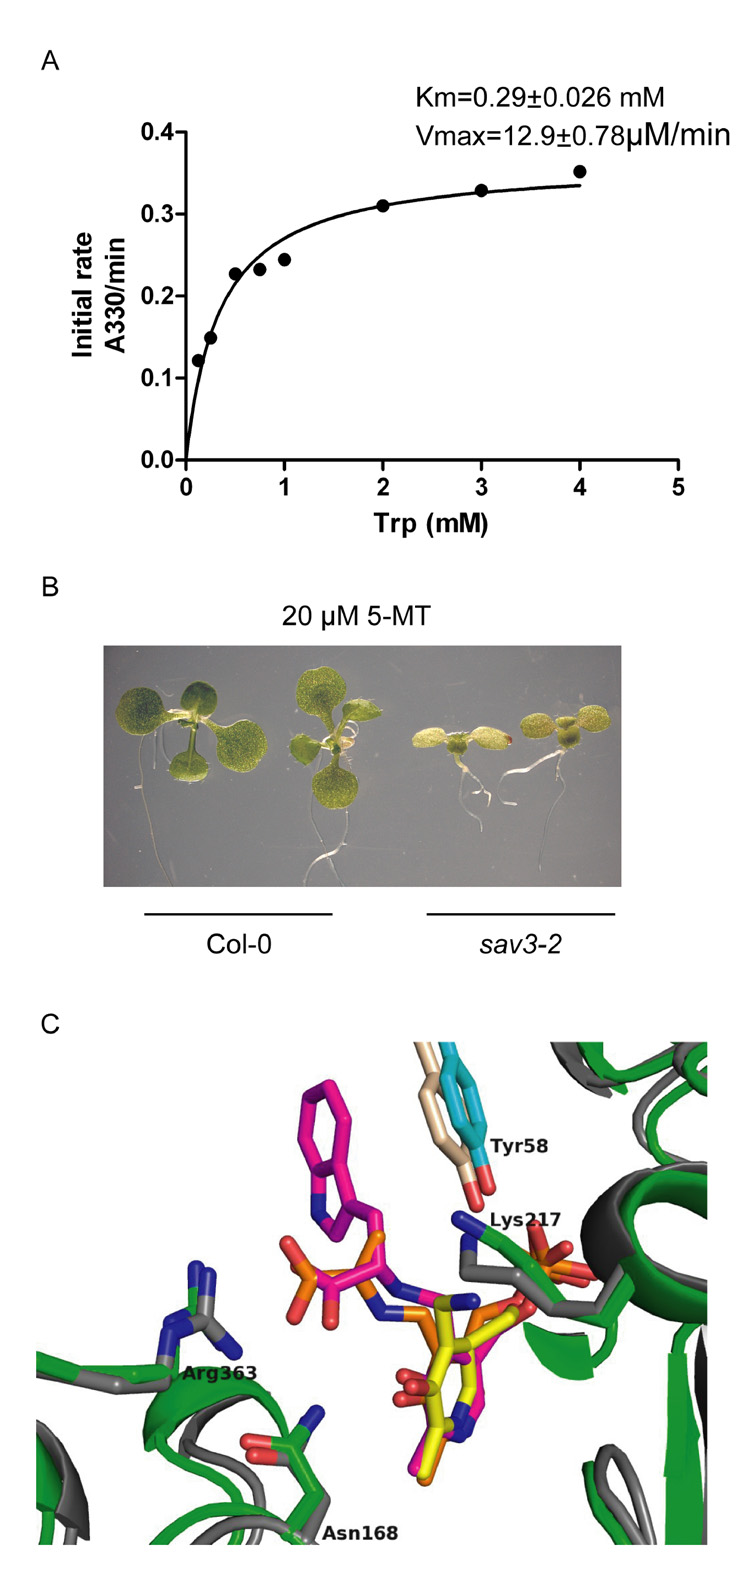
Plants grown at high densities perceive a decrease in the red to far-red (R:FR) ratio of incoming light, resulting from absorption of red light by canopy leaves and reflection of far-red light from neighboring plants. These changes in light quality trigger a series of responses known collectively as the shade avoidance syndrome. During shade avoidance, stems elongate at the expense of leaf and storage organ expansion, branching is inhibited, and flowering is accelerated. We identified several loci in Arabidopsis, mutations in which lead to plants defective in multiple shade avoidance responses. Here we describe TAA1, an aminotransferase, and show that TAA1 catalyzes the formation of indole-3-pyruvic acid (IPA) from L-tryptophan (L-Trp), the first step in a previously proposed, but uncharacterized, auxin biosynthetic pathway. This pathway is rapidly deployed to synthesize auxin at the high levels required to initiate the multiple changes in body plan associated with shade avoidance.
Figures
Comment in
-
A new gene for auxin synthesis.Cell. 2008 Apr 4;133(1):31-2. doi: 10.1016/j.cell.2008.03.014. Cell. 2008. PMID: 18394986
Similar articles
-
TAA1-mediated auxin biosynthesis is essential for hormone crosstalk and plant development.Cell. 2008 Apr 4;133(1):177-91. doi: 10.1016/j.cell.2008.01.047. Cell. 2008. PMID: 18394997
-
A new gene for auxin synthesis.Cell. 2008 Apr 4;133(1):31-2. doi: 10.1016/j.cell.2008.03.014. Cell. 2008. PMID: 18394986
-
Biochemical and Chemical Biology Study of Rice OsTAR1 Revealed that Tryptophan Aminotransferase is Involved in Auxin Biosynthesis: Identification of a Potent OsTAR1 Inhibitor, Pyruvamine2031.Plant Cell Physiol. 2017 Mar 1;58(3):598-606. doi: 10.1093/pcp/pcx007. Plant Cell Physiol. 2017. PMID: 28138057
-
Precise Regulation of the TAA1/TAR-YUCCA Auxin Biosynthesis Pathway in Plants.Int J Mol Sci. 2023 May 10;24(10):8514. doi: 10.3390/ijms24108514. Int J Mol Sci. 2023. PMID: 37239863 Free PMC article. Review.
-
Seedling development in buckwheat and the discovery of the photomorphogenic shade-avoidance response.Plant Biol (Stuttg). 2013 Nov;15(6):931-40. doi: 10.1111/plb.12077. Epub 2013 Sep 24. Plant Biol (Stuttg). 2013. PMID: 24112603 Review.
Cited by
-
A mutation affecting the synthesis of 4-chloroindole-3-acetic acid.Plant Signal Behav. 2012 Dec;7(12):1533-6. doi: 10.4161/psb.22319. Epub 2012 Oct 16. Plant Signal Behav. 2012. PMID: 23073010 Free PMC article.
-
The evolution of the plant genome-to-morphology auxin circuit.Theory Biosci. 2016 Sep;135(3):175-86. doi: 10.1007/s12064-016-0231-0. Epub 2016 Jun 22. Theory Biosci. 2016. PMID: 27333773
-
Tryptophan-independent auxin biosynthesis contributes to early embryogenesis in Arabidopsis.Proc Natl Acad Sci U S A. 2015 Apr 14;112(15):4821-6. doi: 10.1073/pnas.1503998112. Epub 2015 Mar 23. Proc Natl Acad Sci U S A. 2015. PMID: 25831515 Free PMC article.
-
PIF7 is a master regulator of thermomorphogenesis in shade.Nat Commun. 2022 Aug 29;13(1):4942. doi: 10.1038/s41467-022-32585-6. Nat Commun. 2022. PMID: 36038577 Free PMC article.
-
Low Blue Light Enhances Phototropism by Releasing Cryptochrome1-Mediated Inhibition of PIF4 Expression.Plant Physiol. 2020 Aug;183(4):1780-1793. doi: 10.1104/pp.20.00243. Epub 2020 Jun 17. Plant Physiol. 2020. PMID: 32554507 Free PMC article.
References
-
- Aitken SM, Kirsch JF. The enzymology of cystathionine biosynthesis: strategies for the control of substrate and reaction specificity. Arch Biochem Biophys. 2005;433:166–175. - PubMed
-
- Aloni R, Schwalm K, Langhans M, Ullrich CI. Gradual shifts in sites of free-auxin production during leaf-primordium development and their role in vascular differentiation and leaf morphogenesis in Arabidopsis. Planta. 2003;216:841–853. - PubMed
-
- Baca BE, Soto-Urzua L, Xochihua-Corona YG, Cuervo-Garcia A. Characterization of two aromatic amino acid aminotransferases and production of indole-3-acetic acid in Azospirillum spp. strains. Soil Biol Biochem. 1994;26:57–63.
-
- Badenoch-Jones J, Summons RE, Rolfe BG, Parker CW, Letham DS. Mass spectrometric identification of indole compounds produced by Rhizobium strains. Biomed Mass Spectrom. 1982;9:429–437.
-
- Ballare CL. Keeping up with the neighbours: phytochrome sensing and other signalling mechanisms. Trends Plant Sci. 1999;4:97–102. - PubMed
Publication types
MeSH terms
Substances
Associated data
- Actions
Grants and funding
LinkOut - more resources
Full Text Sources
Other Literature Sources
Molecular Biology Databases
