Comparative Study
. 2008 Apr;134(4):1017-27.
doi: 10.1053/j.gastro.2008.01.008. Epub 2008 Jan 11.

Gliadin activates HLA class I-restricted CD8+ T cells in celiac disease intestinal mucosa and induces the enterocyte apoptosis

Affiliations
Comparative Study

Gliadin activates HLA class I-restricted CD8+ T cells in celiac disease intestinal mucosa and induces the enterocyte apoptosis

Giuseppe Mazzarella et al. Gastroenterology. 2008 Apr.

Abstract

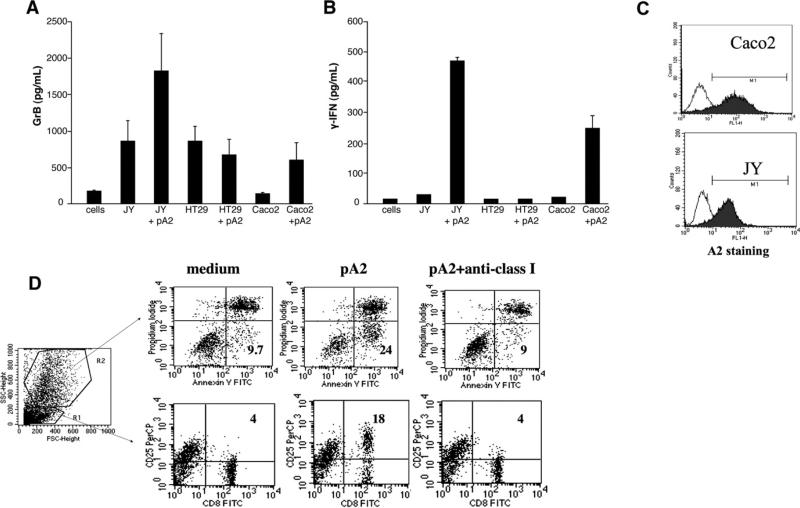
Background & aims: The extensive infiltration of CD8(+) T cells in the intestinal mucosa of celiac disease (CD) patients is a hallmark of the disease. We identified a gliadin peptide (pA2) that is selectively recognized by CD8(+) T cells infiltrating intestinal mucosa of HLA-A2(+) CD patients. Herein, we investigated the phenotype, the tissue localization, and the effector mechanism of cells responsive to pA2 by using the organ culture of CD intestinal mucosa. The target of pA2-mediated cytotoxicity was also investigated by using the intestinal epithelial cell lines Caco2 and HT29, A2(+) and A2(-), respectively, as target cells.

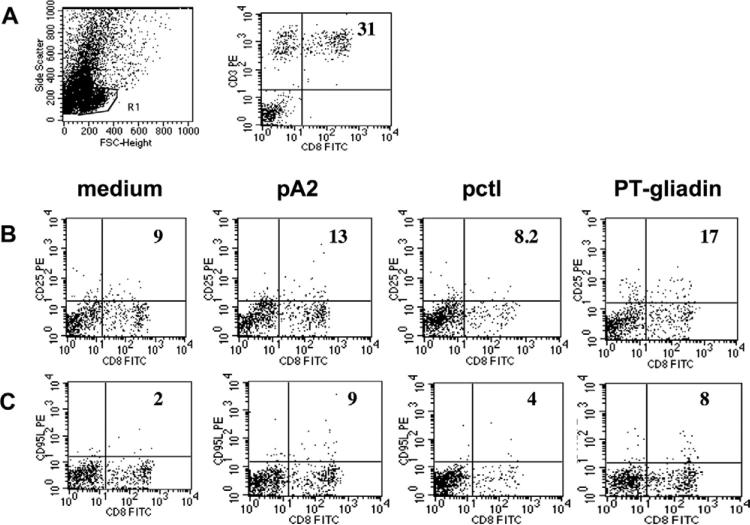
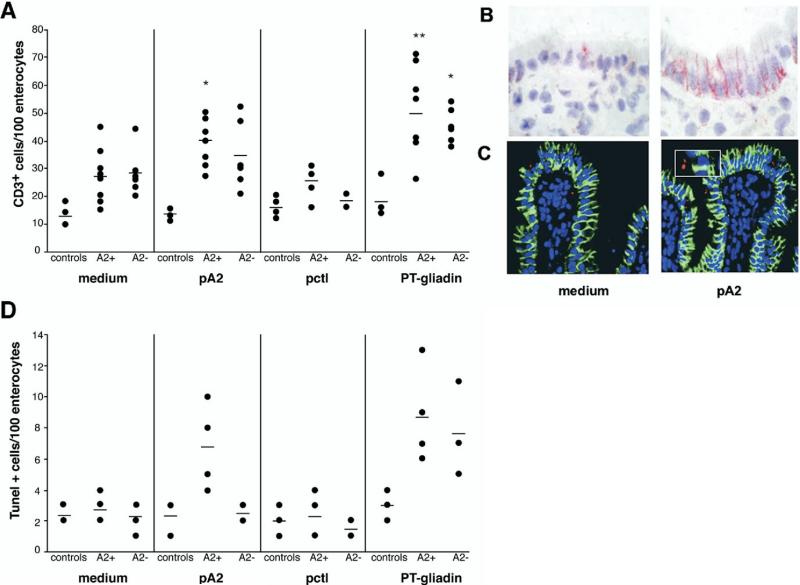
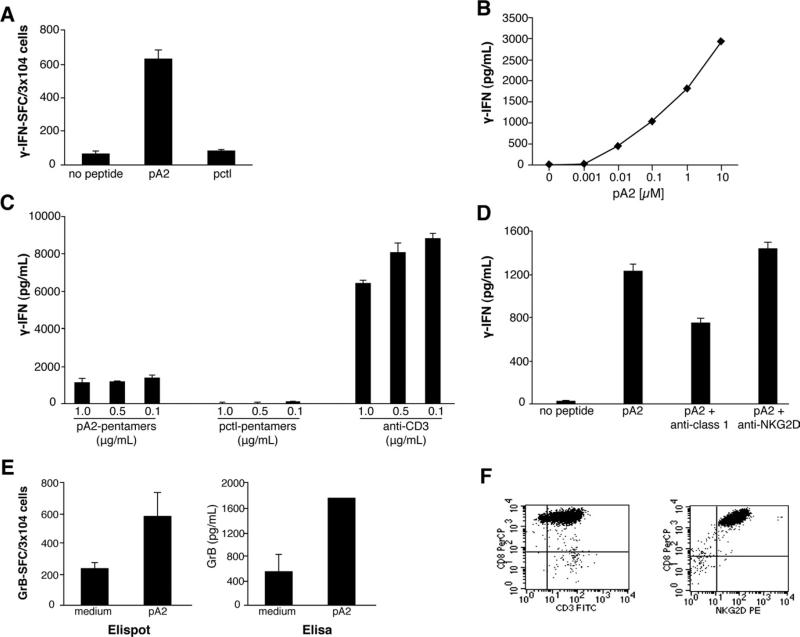
Methods: Jejunal biopsy specimens from CD patients were cultured in vitro with pA2, and cellular activation was evaluated by immunohistochemistry and cytofluorimetric analysis. Cytotoxicity of pA2-specific, intestinal CD8(+) T cells was assayed by granzyme-B and interferon-gamma release and by apoptosis of target cells.

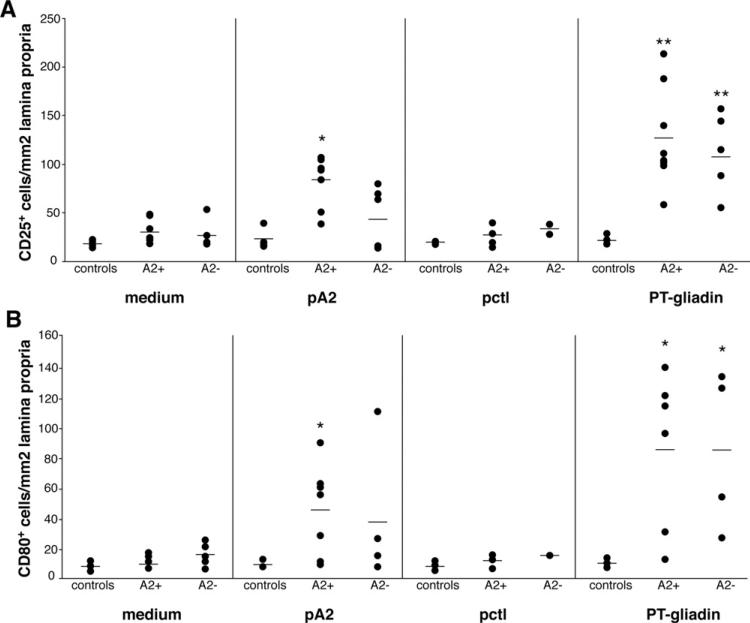
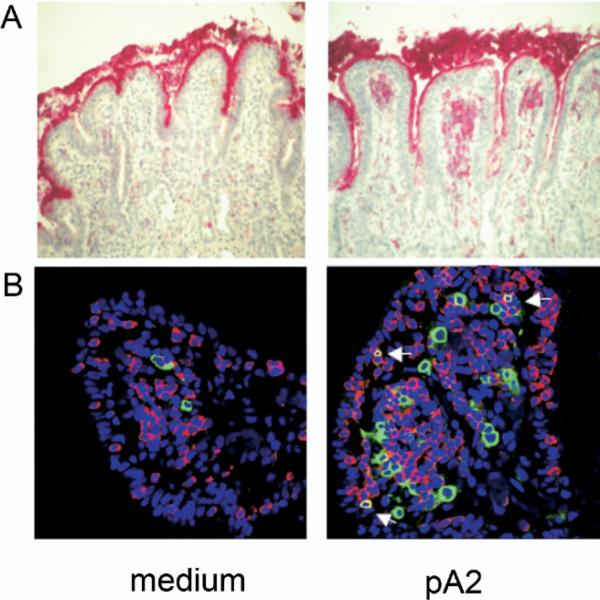
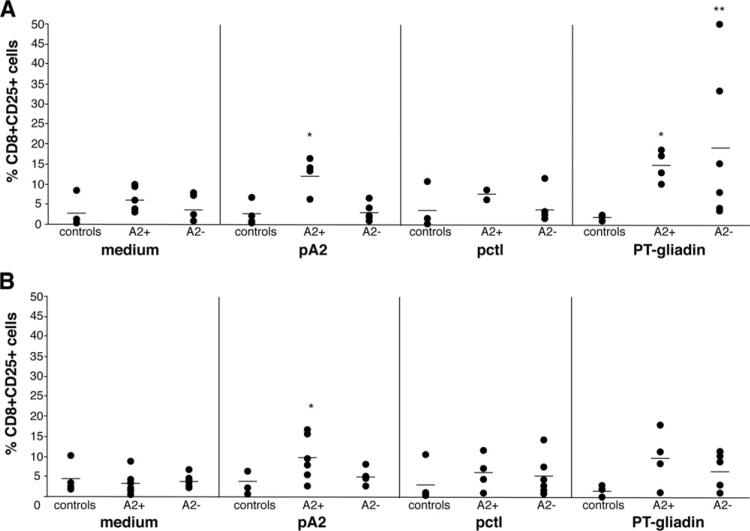
Results: pA2 challenge of A2(+) CD mucosa increased the percentage of CD8(+)CD25(+) and of CD80(+) cells in the lamina propria, the former mainly localized beneath the epithelium, as well as the number of terminal deoxynucleotidyltransferase-mediated dUTP nick-end labeling-positive cells (TUNEL(+)) in the epithelium. Intraepithelial CD3(+) cells and enterocyte expression of Fas were also increased. CD8(+)CD25(+) and CD8(+)FASL(+) T cells were significantly increased in cell preparations from biopsy specimens cultured with pA2. CD8(+) T-cell lines released both granzyme-B and interferon-gamma following recognition of pA2 when presented by Caco2 and not by HT29.

Conclusions: These data indicate that gliadins contain peptides able to activate, through a TCR/HLA class I interaction, CD8-mediated response in intestinal CD mucosa and to induce the enterocyte apoptosis.


Figures

Figure 1
Figure 1
pA2 challenge increased CD25+ and CD80+ mononuclear cells in jejunal biopsy specimen from A2+ CD patients. Mucosal explants from HLA-A2+, HLA-A2 CD patients and controls were cultured in vitro with medium alone, gliadin peptide (pA2), control peptide (pctl), or PT-gliadin. CD25+ (A) and CD80+ (B) mononuclear cells were counted per square millimeter of lamina propria. Dashes indicate the mean values. Statistical significance was evaluated comparing responses to peptides/ PT-gliadin with responses to medium alone for each group of subjects. *P < .01, **P < .001.
Figure 2
Figure 2
Activated CD25+ cells localized in the subepithelial region. (A) Mononuclear cells expressing CD25 were evaluated by IHC on 5-mm cryostat sections of jejunal mucosa cultured as described in Figure 1 legend. Mucosal sections from a representative A2+ CD patient cultured in vitro with medium only or with pA2 are illustrated. Activated CD25+ cells were observed only in the lamina propria and in the subepithelial region. (B) Immunofluorescence staining for CD8 and CD25. Number of CD8+ intraepithelial lymphocytes (red) were increased following pA2 challenge compared with medium alone; also evident is the increase of CD25+ cells (green) and of CD8+CD25+ activated T cells (yellow), particularly in the subepithelial region (arrows). A similar pattern was observed when the mucosa were cultured with the peptic-tryptic digest of gliadin.
Figure 3
Figure 3
Ex vivo flow cytometry profile of cells infiltrating the organ-cultured intestinal mucosa. (A) FACS profile of intestinal cells and percentage of CD3+CD8+ cells infiltrating intestinal CD mucosa. R1 indicates the gate of live cells analyzed. (B) Percentage of CD8+CD25+ and (C) of CD8+CD95L+ cells observed in intestinal biopsy specimens cultured with medium alone, pA2, pctl, or PT-gliadin from 1 representative A2+ CD patient. Numbers indicate percentage of double positive cells normalized on total number of CD8+ cells gated in R1.
Figure 4
Figure 4
pA2 challenge of treated mucosa induced the expression of CD25 and CD95L molecules on CD8+ T cells. (A) Immunostaining for CD8CD25 and (B) for CD8CD95L was performed on cells immediately after their isolation from intestinal biopsy specimens cultured as described in Figure 1 legend. Percentage of double positive cells were evaluated as shown in Figure 3. Dashes indicate the mean value obtained for each group of subjects. Statistical significance was evaluated comparing responses to peptides/ PT-gliadin with responses to medium alone. **P < .001, *P < .05.
Figure 5
Figure 5
pA2-induced immune activation in the epithelium compartment. (A) Number of CD3+ cells infiltrating the epithelium of jejunal specimens cultured in vitro with medium alone, A2-restricted peptide (pA2), control peptide (pctl), or PT-gliadin. CD3+ cells were counted in at least 3 different fields containing 100 enterocytes each. The mean value is reported for each subject, and dashes indicate the mean values obtained for each group. (B) FAS epithelium expression in the jejunal mucosa from an A2+ CD patient. (C) Villous epithelium of mucosal ex-plants from a representative A2+ CD patient showing apoptotic bodies (red) and cytokeratin+ cells (green; image magnification, ×40; inset, ×60). (D) Overall results of TUNEL+ cells counted in the villous epithelium of organ cultured biopsy specimens. TUNEL+ cells were counted in at least 3 different fields containing 100 enterocytes each. The mean value is reported for each subject, and dashes indicate the mean values obtained for each group. Statistical significance was evaluated for panel A as indicated in Figure 1. *P < .01, **P < .001.
Figure 6
Figure 6
pA2 recognition by intestinal CD8+ T cells occurs in the context of HLA-A2 restriction and via the TCR activation. (A and B) CD8+ CTL generated from intestinal mucosa of A2+ CD mucosa were assayed for IFN-γ release upon pA2 recognition by both ELISPOT (A) and ELISA (B) assays. CD8+ T cells (0.3 × 10⁵) were stimulated with HLA-A2+ JY cells (1 × 10⁵) in the presence of medium alone or pA2 at 20 μg/mL (A) or in a dose curve response (B) for 20–48 hours. (C) Peptide-HLA-A2.1 pentamers or anti-CD3 were immobilized onto 96-well plate and used to stimulate CD8+ CTLs. (D) pA2 recognition by CD8+ CTLs in the absence or presence of blocking anti-HLA class I or anti-NKG2D monoclonal antibodies (10 μg/mL of each monoclonal antibody). (E) pA2-induced GrB production was assessed by both ELISPOT and ELISA. Results are shown as mean ± SD of duplicate experiments. (F) FACS profile of pA2-specific intestinal CD8+ CTL.
Figure 7
Figure 7
HLA-A2+ epithelial cells are target of pA2-induced CD8+ T-cell activation. (A and B) The epithelial cell lines Caco2 (A2+) and HT29 (A2) were used as APC (1 × 10⁵) to stimulate pA2-specific CD8+ T cells (0.3 × 10⁵). Levels of IFN-γ and GrB were evaluated in cell supernatants following 48 hours of incubation. (C) Basal level of HLA-A2 expressed on cell's surface of APCs (JY and Caco2). (D) Apoptosis of epithelial cells (gated in R2) and CD25 expression on T cells (gated in R1) were analyzed in coculture experiments.

References

    1. Sollid LM. Celiac disease: dissecting a complex inflammatory disorder. Nat Rev Immunol. 2002;2:647–655. - PubMed
    1. Lundin KE, Scott H, Hansen T, et al. Gliadin-specific HLA-DQ(a1*0501,b1*0201) restricted T-cells isolated from the small intestinal mucosa of celiac disease patients. J Exp Med. 1993;178:187–196. - PMC - PubMed
    1. van de Wal Y, Kooy Y, van Veelen P, et al. Small intestinal T cells of celiac disease patients recognize a natural peptide fragment of gliadin. Proc Natl Acad Sci U S A. 1998;95:10050–10054. - PMC - PubMed
    1. Troncone R, Gianfrani C, Mazzarella G, et al. Majority of gliadin-specific T-cell clones from celiac small intestinal mucosa produce interferon-γ and interleukin-4. Dig Dis Sci. 1998;43:156–161. - PubMed
    1. Gianfrani C, Troncone R, Magione P, et al. Celiac disease association with CD8+ T-cell responses: identification of a novel gliadin-derived HLA-A2 restricted epitope. J Immunol. 2003;170:2719–2726. - PubMed

Publication types

MeSH terms