. 2008 Jun;29(18):2705-9.
doi: 10.1016/j.biomaterials.2008.03.014.

The role of cerium redox state in the SOD mimetic activity of nanoceria

Affiliations

The role of cerium redox state in the SOD mimetic activity of nanoceria

Eric G Heckert et al. Biomaterials. 2008 Jun.

Abstract

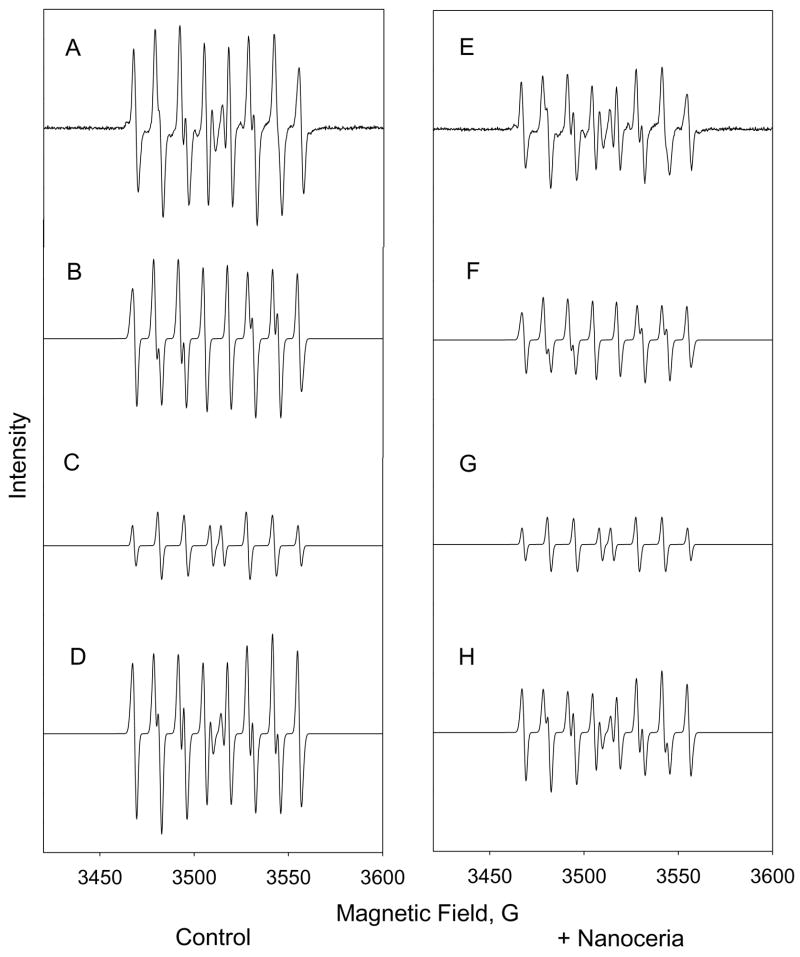
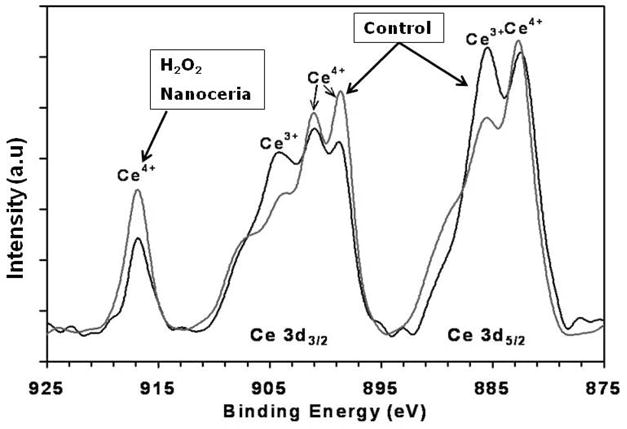
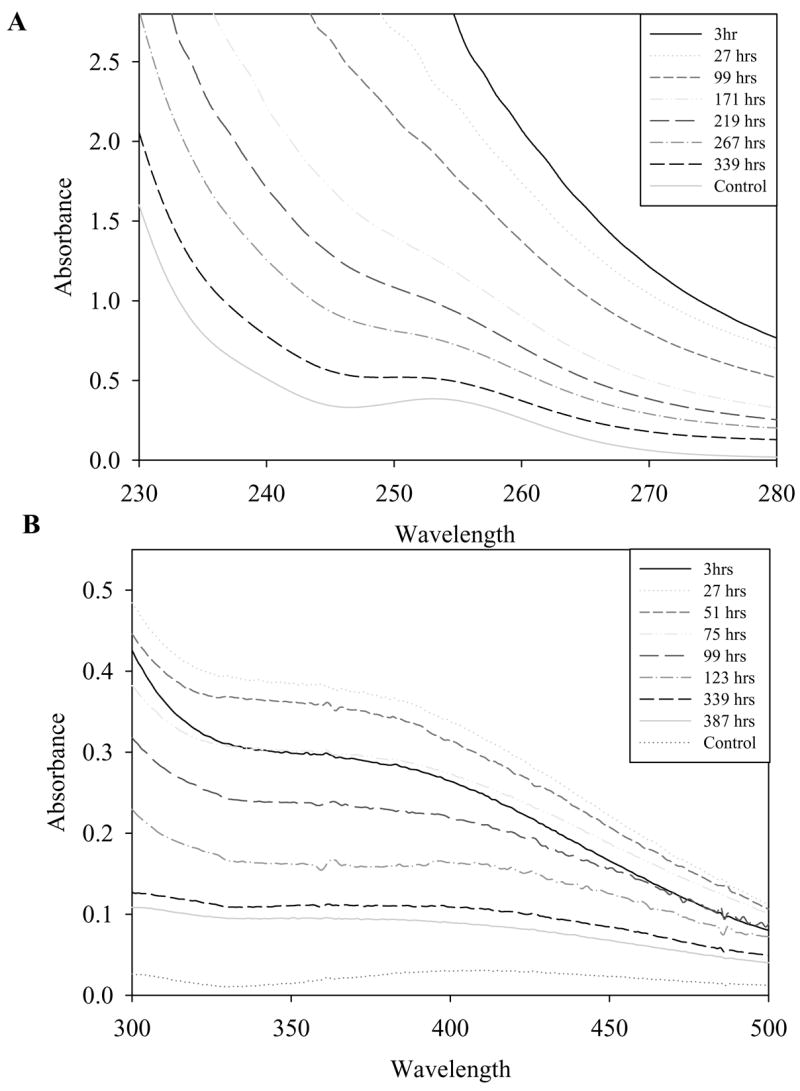
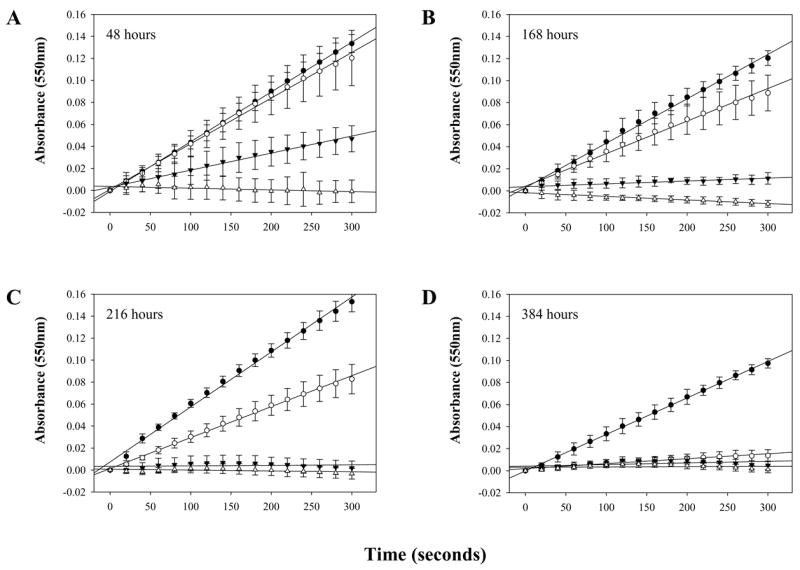
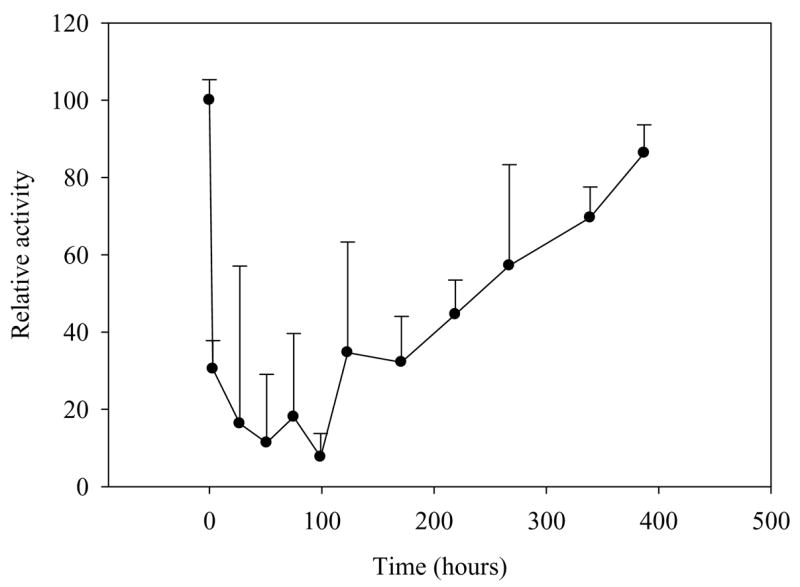
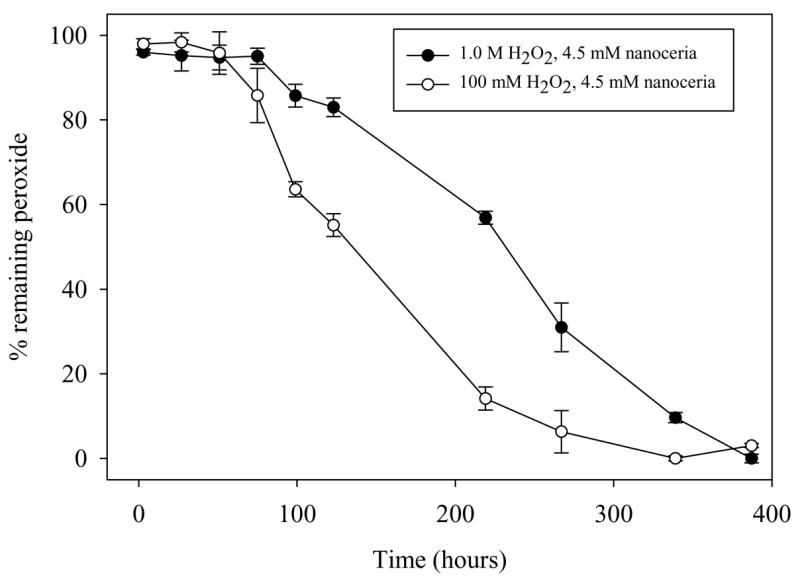
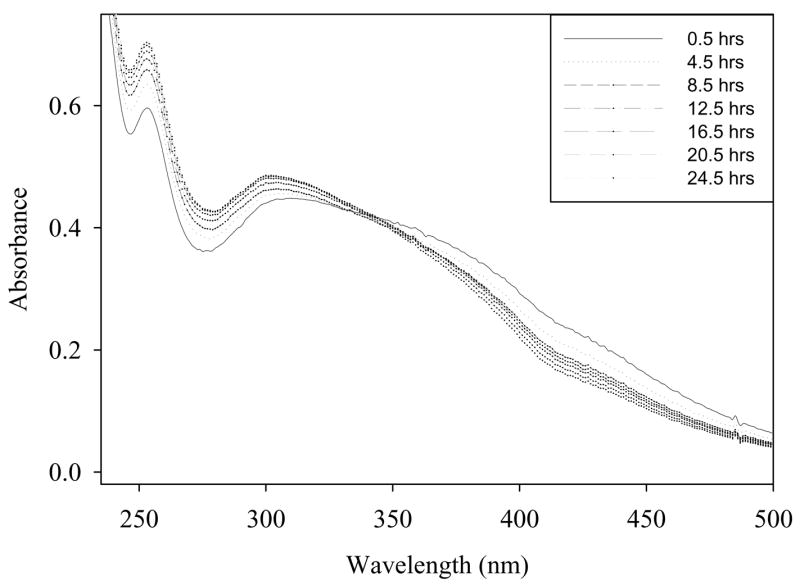
Cerium oxide nanoparticles (nanoceria) have recently been shown to protect cells against oxidative stress in both cell culture and animal models. Nanoceria has been shown to exhibit superoxide dismutase (SOD) activity using a ferricytochrome C assay, and this mimetic activity that has been postulated to be responsible for cellular protection by nanoceria. The nature of nanoceria's antioxidant properties, specifically what physical characteristics make nanoceria effective at scavenging superoxide anion, is poorly understood. In this study electron paramagnetic resonance (EPR) analysis confirms the reactivity of nanoceria as an SOD mimetic. X-ray photoelectron spectroscopy (XPS) and UV-visible analyses of nanoceria treated with hydrogen peroxide demonstrate that a decrease in the Ce 3(+)/4(+) ratio correlates directly with a loss of SOD mimetic activity. These results strongly suggest that the surface oxidation state of nanoceria plays an integral role in the SOD mimetic activity of nanoceria and that ability of nanoceria to scavenge superoxide is directly related to cerium(III) concentrations at the surface of the particle.


Figures

Figure 1
Figure 1. EPR spin-trap analysis confirms SOD mimetic characteristic of nanoceria
The left column represents superoxide DEPMPO adduct signal generated by hypoxanthine and xanthine oxidase in the absence of nanoceria. The right column contains identical conditions with the exception of the addition of nanoceria. (A,E) represent baseline corrected EPR spectrum. (B,F) are simulated signals for superoxide adduct. (C,G) are simulated signals for hydroxyl radical adduct. (D,H) are combined simulated EPR signals.
Figure 2
Figure 2. XPS analysis of peroxide treated nanoceria
XPS spectra show the relative concentration of cerium (III) and cerium (IV) oxidation states. The peaks between 875 to 895 eV belong to the Ce 3d5/2 while peaks between 895–910 eV correspond to the Ce 3d3/2 levels. The peak at 916 eV is a characteristic satellite peak indicating the presence of cerium (IV). The spectra clearly show a difference in the population density of oxidation states of nanoceria upon addition of hydrogen peroxide. After the addition of hydrogen peroxide cerium (III) levels decrease while a corresponding increase in cerium (IV) is observed.
Figure 3
Figure 3. Oxidation of nanoceria leads to reduction in SOD mimetic activity
(A) Competitive inhibition of ferricytochrome C reduction by superoxide after approximately 2 days, Filled circle: control, Open circle: 1.0 M H2O2 treated nanoceria, Filled triangle: 100 mM H2O2 treated nanoceria, Open triangle untreated nanoceria control. (B) 7 days (C) 9 days (D) 16 days. Control is untreated nanoceria.
Figure 4
Figure 4. Oxidized nanoceria SOD mimetic activity returns over time
Analysis of nanoceria SOD mimetic activity over time shows a reduction of activity after hydrogen peroxide treatment followed by a slow return in activity over approximately two weeks.
Figure 5
Figure 5. Hydrogen peroxide levels in oxidized samples do not correlate with SOD mimetic activity
Hydrogen peroxide levels were measured using an amplex red assay. Peroxide levels were measured at set time points from 3 hours to approximately 384 hours.
Figure 6
Figure 6. UV-visible spectrophotometric analysis reveal changes in Ce 3+/4+ surface of hydrogen peroxide treated nanoceria
UV-Visible spectra of nanoceria treated with 1.0 M hydrogen peroxide absorbance in the 400 nm range is due to cerium (IV). (A) UV-Visible spectra of nanoceria treated with 1.0 M hydrogen peroxide absorbance peaks at 255 nm are due to cerium (III) absorbance. (B) Spectra of 300 to 400 nm range of hydrogen peroxide treated nanoceria at various time points.
Figure 7
Figure 7. Change in nanoceria spectrum over time after addition of catalase
Spectrophotometric analysis of hydrogen peroxide treated nanoceria. Samples were treated with hydrogen peroxide for two days to insure oxidation of nanoceria then four units of catalase were added to remove excess peroxide. Note the peak at 252 nm corresponding to cerium (III) was previously obscured by excess hydrogen peroxide.

References

    1. Hu ZY, Haneklaus S, Sparovek G, Schnug E. Rare earth elements in soils. Commun Soil Sci Plan. 2006;37(9–10):1381–1420.
    1. Medalia A, Byrne B. Spectrophotometric Determination of of Cerium (IV) Anal Chem. 1951;23(3):453–456.
    1. Teeguarden JG, Hinderliter PM, Orr G, Thrall BD, Pounds JG. Particokinetics in vitro: dosimetry considerations for in vitro nanoparticle toxicity assessments. Toxicol Sci. 2007 Feb;95(2):300–312. - PubMed
    1. Esch F, Fabris S, Zhou L, Montini T, Africh C, Fornasiero P, et al. Electron localization determines defect formation on ceria substrates. Science. 2005 Jul 29;309(5735):752–755. - PubMed
    1. Campbell CT, Peden CH. Chemistry. Oxygen vacancies and catalysis on ceria surfaces. Science. 2005 Jul 29;309(5735):713–714. - PubMed

Publication types

MeSH terms