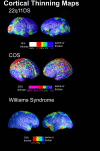
Neural phenotypes of common and rare genetic variants
- PMID: 18395317
- PMCID: PMC2535822
- DOI: 10.1016/j.biopsycho.2008.02.005
Neural phenotypes of common and rare genetic variants
Abstract
Neuroimaging methods offer a powerful way to bridge the gaps between genes, neurobiology and behavior. Such investigations may be further empowered by complementary strategies involving chromosomal abnormalities associated with particular neurobehavioral phenotypes, which can help to localize causative genes and better understand the genetics of complex traits in the general population. Here we review the evidence from studies using these convergent approaches to investigate genetic influences on brain structure: (1) studies of common genetic variations associated with particular neuroanatomic phenotypes, and (2) studies of possible 'genetic subtypes' of neuropsychiatric disorders with very high penetrance, with a focus on neuroimaging studies using novel computational brain mapping algorithms. Finally, we discuss the contribution of behavioral neurogenetics research to our understanding of the genetic basis of neuropsychiatric disorders in the broader population.
Figures


Similar articles
-
Cortical mapping of genotype-phenotype relationships in schizophrenia.Hum Brain Mapp. 2007 Jun;28(6):519-32. doi: 10.1002/hbm.20404. Hum Brain Mapp. 2007. PMID: 17437284 Free PMC article. Review.
-
Reverse genetics of the mouse central nervous system: targeted genetic analysis of neuropeptide function and reverse genetic screens for genes involved in human neurodegenerative disease.Prog Neurobiol. 1994 Feb;42(2):319-31. doi: 10.1016/0301-0082(94)90072-8. Prog Neurobiol. 1994. PMID: 8008831 Review.
-
Critical reappraisal of mechanistic links of copy number variants to dimensional constructs of neuropsychiatric disorders in mouse models.Psychiatry Clin Neurosci. 2018 May;72(5):301-321. doi: 10.1111/pcn.12641. Epub 2018 Mar 1. Psychiatry Clin Neurosci. 2018. PMID: 29369447 Free PMC article. Review.
-
Advances in understanding behavioral phenotypes in neurogenetic syndromes.Am J Med Genet C Semin Med Genet. 2010 Nov 15;154C(4):389-99. doi: 10.1002/ajmg.c.30276. Am J Med Genet C Semin Med Genet. 2010. PMID: 20981768 Review.
-
Dilemmas in genetic counseling for low-penetrance neuro-susceptibility loci detected on prenatal chromosomal microarray analysis.Am J Obstet Gynecol. 2018 Feb;218(2):247.e1-247.e12. doi: 10.1016/j.ajog.2017.11.559. Epub 2017 Nov 14. Am J Obstet Gynecol. 2018. PMID: 29146387
Cited by
-
Insights into brain development from neurogenetic syndromes: evidence from fragile X syndrome, Williams syndrome, Turner syndrome and velocardiofacial syndrome.Neuroscience. 2009 Nov 24;164(1):257-71. doi: 10.1016/j.neuroscience.2009.04.033. Epub 2009 Apr 17. Neuroscience. 2009. PMID: 19376197 Free PMC article. Review.
-
Cyclin D1 rare variants in UK multiple adenoma and early-onset colorectal cancer patients.J Hum Genet. 2011 Jan;56(1):58-63. doi: 10.1038/jhg.2010.144. Epub 2010 Nov 25. J Hum Genet. 2011. PMID: 21107342 Free PMC article.
-
The future of genetics in psychology and psychiatry: microarrays, genome-wide association, and non-coding RNA.J Child Psychol Psychiatry. 2009 Jan;50(1-2):63-71. doi: 10.1111/j.1469-7610.2008.01978.x. J Child Psychol Psychiatry. 2009. PMID: 19220590 Free PMC article. Review.
-
Genetic architecture of declarative memory: implications for complex illnesses.Neuroscientist. 2012 Oct;18(5):516-32. doi: 10.1177/1073858411415113. Epub 2011 Aug 10. Neuroscientist. 2012. PMID: 21832260 Free PMC article. Review.
-
Social cognition in 22q11.2 microdeletion syndrome: relevance to psychosis?Schizophr Res. 2012 Dec;142(1-3):99-107. doi: 10.1016/j.schres.2012.10.007. Epub 2012 Oct 31. Schizophr Res. 2012. PMID: 23122739 Free PMC article.
References
-
- Alivisatos B, Petrides M. Functional activation of the human brain during mental rotation. Neuropsychologia. 1997;35(2):111–118. - PubMed
-
- Alkan A, Sarac K, Kutlu R, Yakinci C, Sigirci A, Aslan M, et al. Proton MR spectroscopy features of normal appearing white matter in neurofibromatosis type 1. Magn Reson Imaging. 2003;21(9):1049–1053. - PubMed
-
- Alkan A, Sigirci A, Kutlu R, Ozcan H, Erdem G, Aslan M, et al. Neurofibromatosis type 1: diffusion weighted imaging findings of brain. Eur J Radiol. 2005;56(2):229–234. - PubMed
-
- Antshel KM, Conchelos J, Lanzetta G, Fremont W, Kates WR. Behavior and corpus callosum morphology relationships in velocardiofacial syndrome (22q11.2 deletion syndrome) Psychiatry Res. 2005;138(3):235–245. - PubMed
Publication types
MeSH terms
Grants and funding
- K23 MH074644/MH/NIMH NIH HHS/United States
- NS049194/NS/NINDS NIH HHS/United States
- AG016570/AG/NIA NIH HHS/United States
- UL1 RR024911/RR/NCRR NIH HHS/United States
- UL1RR024911/RR/NCRR NIH HHS/United States
- P20RR020750/RR/NCRR NIH HHS/United States
- R01 HD050735/HD/NICHD NIH HHS/United States
- U54 RR021813/RR/NCRR NIH HHS/United States
- LM05639/LM/NLM NIH HHS/United States
- RL1 DA024853/DA/NIDA NIH HHS/United States
- P20 RR020750/RR/NCRR NIH HHS/United States
- R21 RR019771/RR/NCRR NIH HHS/United States
- R01 LM005639/LM/NLM NIH HHS/United States
- HD050735/HD/NICHD NIH HHS/United States
- EB01651/EB/NIBIB NIH HHS/United States
- RR019771/RR/NCRR NIH HHS/United States
- P50 AG016570/AG/NIA NIH HHS/United States
LinkOut - more resources
Full Text Sources
Medical

