. 2008 Jun;19(6):814-22.
doi: 10.1016/j.jasms.2008.03.002. Epub 2008 Mar 18.

MALDI tissue profiling of integral membrane proteins from ocular tissues

Affiliations

MALDI tissue profiling of integral membrane proteins from ocular tissues

Danielle B Thibault et al. J Am Soc Mass Spectrom. 2008 Jun.

Abstract

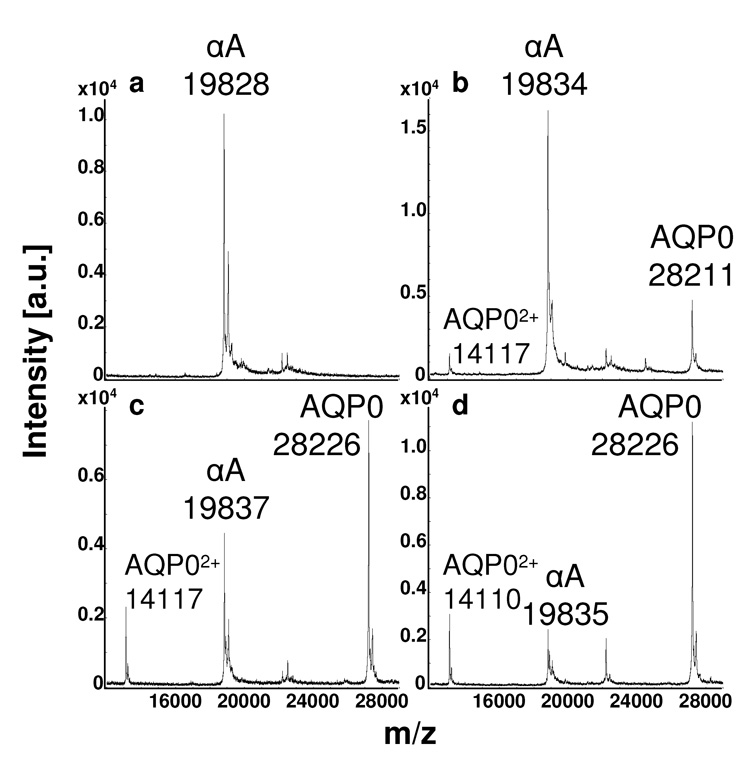
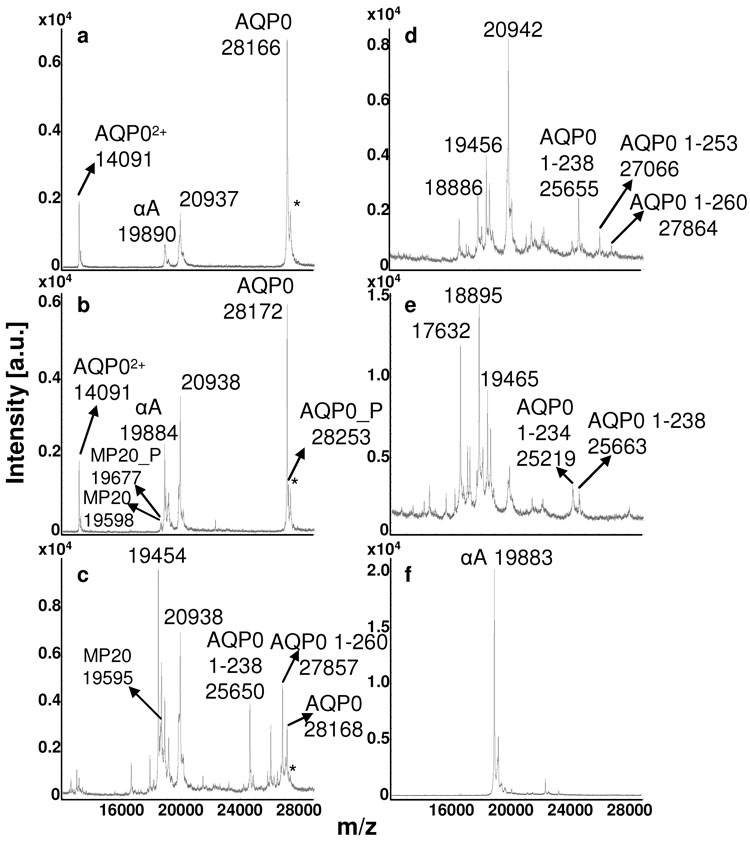
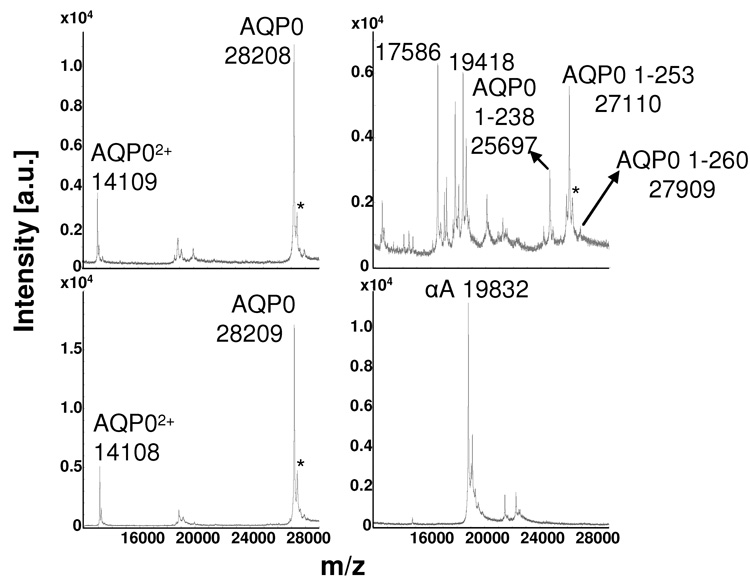
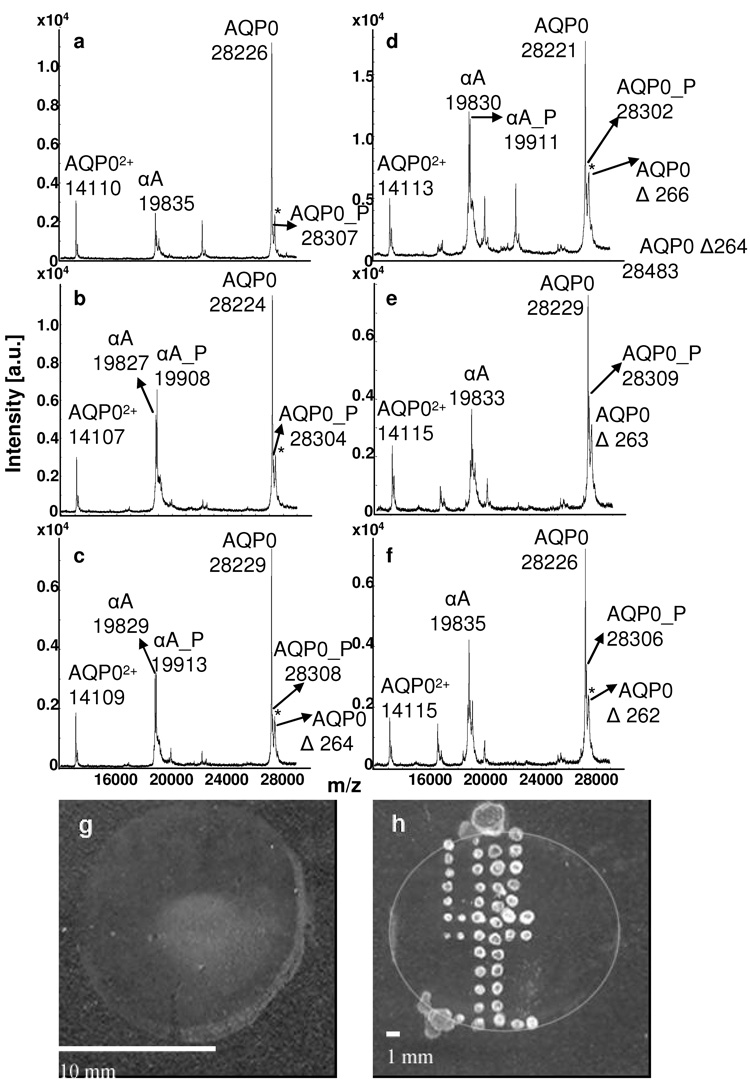
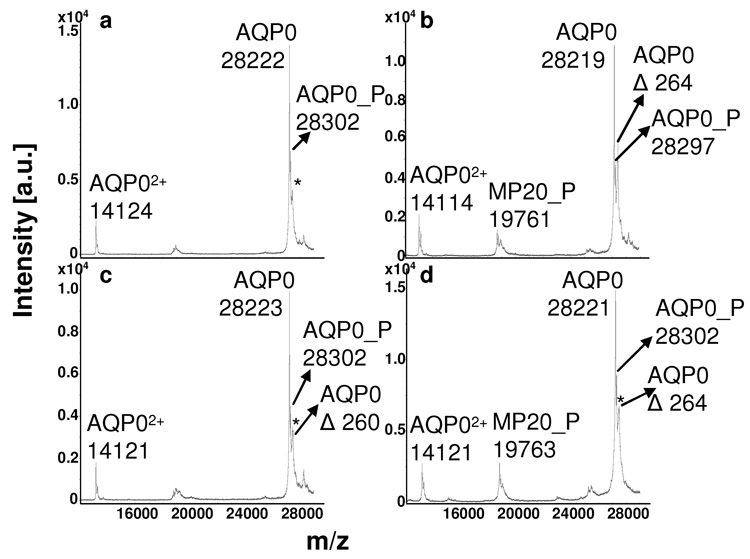
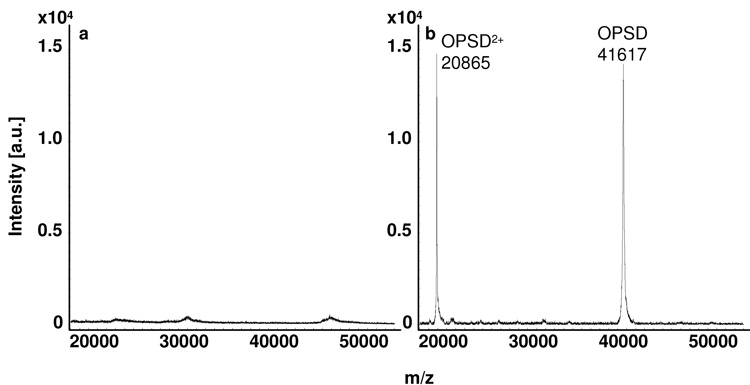
MALDI tissue profiling and imaging have become valuable tools for rapid, direct analysis of tissues to investigate spatial distributions of proteins, potentially leading to an enhanced understanding of the molecular basis of disease. Sample preparation methods developed to date for these techniques produce protein expression profiles from predominantly hydrophilic, soluble proteins. The ability to obtain information about the spatial distribution of integral membrane proteins is critical to more fully understand their role in physiological processes, including transport, adhesion, and signaling. In this article, a sample preparation method for direct tissue profiling of integral membrane proteins is presented. Spatially resolved profiles for the abundant lens membrane proteins aquaporin 0 (AQP0) and MP20, and the retinal membrane protein opsin, were obtained using this method. MALDI tissue profiling results were validated by analysis of dissected tissue prepared by traditional membrane protein processing methods. Furthermore, direct tissue profiling of lens membrane proteins revealed age related post-translational modifications, as well as a novel modification that had not been detected using conventional tissue homogenization methods.


Figures

Figure 1
Figure 1
MALDI tissue profiles of the outer cortex from bovine lens sections that were: a) unwashed and spotted without 7:3 FA:HFIP, b) unwashed and spotted with 7:3 FA:HFIP, c) washed with water and spotted without 7:3 FA:HFIP, or d) washed with water and spotted with 7:3 FA:HFIP. Application of 7:3 FA:HFIP prior to matrix deposition promotes solubilization of the membrane protein AQP0, and washing the tissue with water removes the signals due to soluble crystallin proteins (19–24 kDa), which would otherwise suppress the signal of AQP0. “αA” represents αA crystallin 1-173; AQP0 represents AQP0 1-263.
Figure 2
Figure 2
MALDI tissue profiles of rabbit lens sections (diameter = 1.1 cm) from a) the outer cortex, b) inner cortex, c) outer core, d) inner core, and e) core regions. Truncation of AQP0 increases with fiber cell age. A profile of the outer cortical region after washing and 7:3 FA:HFIP treatment (a) can be compared to a profile from the outer cortical region before washing and 7:3 FA:HFIP treatment (f). “αA” represents αA crystallin 1-173; AQP0 represents AQP0 1-263; MP20 represents MP20 1-173. “P” indicates the phosphorylated forms of AQP0 and MP20. The asterisks mark sinapinic acid adducts (Δm = 206 Da) to the full length AQP0 protein.
Figure 3
Figure 3
MALDI tissue profiles of rat lens sections (diameter = 0.5 cm) from a) the outer cortex, b) inner cortex, and c) core regions. Truncation of AQP0 increases with fiber cell age. A profile of the outer cortical region after washing and 7:3 FA:HFIP treatment (a) can be compared to a profile from the outer cortical region before washing and 7:3 FA:HFIP treatment (d). AQP0 represents AQP0 1-263; MP20 represents MP20 1-173. “P” indicates the phosphorylated form of MP20. The asterisks mark sinapinic acid adducts (Δm = 206 Da) to the full length AQP0 protein.
Figure 4
Figure 4
MALDI tissue profiles of bovine lens sections (diameter = 1.5 cm) from the a) outer cortex, b) inner cortex, c) deep cortex, d) outer core, e) inner core, and f) core regions. A novel modification to AQP0 localizes to deep cortical and core regions of the lens. “αA” represents αA crystallin 1-173; AQP0 represents AQP0 1-263; MP20 represents MP20 1-173. “P” indicates the phosphorylated forms of αA crystallin and AQP0. The asterisks mark sinapinic acid adducts (Δm = 206 Da) to the full length AQP0 protein. Also shown are scanned images of 20 µm bovine lens sections unwashed (g) or water washed and spotted with 7:3 FA:HFIP and saturated sinapinic acid matrix (h). A circle has been included in panel “h” to show the approximate outer edge of the lens section. The average spot size in panel “h” is 0.09 ± 0.01 mm.
Figure 5
Figure 5
MALDI profiles of bovine lens homogenates from the a) outer cortex, b) inner cortex, c) outer core, and d) core regions. AQP0 represents AQP0 1-263; MP20 represents MP20 1-173. “P” indicates the phosphorylated forms of MP20 and AQP0. The asterisks mark sinapinic acid adducts (Δm = 206 Da) to the full length AQP0 protein.
Figure 6
Figure 6
MALDI tissue profiles of pig retina from a) a water washed section not treated with FA:HFIP, and b) a water washed section treated with 7:3 FA:HFIP. OPSD represents full length opsin, OPSD 1-348.

References

    1. Karas M, Hillenkamp F. Laser desorption ionization of proteins with molecular masses exceeding 10,000 daltons. Anal Chem. 1988;60:2299–2301. - PubMed
    1. Roepstorff P. Mass spectrometry in protein studies from genome to function. Curr Opin Biotechnol. 1997;8:6–13. - PubMed
    1. Russell DH, Edmondson RD. High-resolution Mass Spectrometry and Accurate Mass Measurements with Emphasis on the Characterization of Peptides and Proteins by Matrix-assisted Laser Desorption/Ionization Time-of-flight Mass Spectrometry. Journal of Mass Spectrometry. 1997;32:263–276.
    1. Caldwell RL, Caprioli RM. Tissue profiling by mass spectrometry: a review of methodology and applications. Mol Cell Proteomics. 2005;4:394–401. - PubMed
    1. Chaurand P, Caprioli RM. Direct profiling and imaging of peptides and proteins from mammalian cells and tissue sections by mass spectrometry. Electrophoresis. 2002;23:3125–3135. - PubMed

Publication types

Substances