Review
. 2008 May;38(3):177-98.
doi: 10.1053/j.semnuclmed.2008.01.001.

Technological development and advances in single-photon emission computed tomography/computed tomography

Affiliations
Review

Technological development and advances in single-photon emission computed tomography/computed tomography

Youngho Seo et al. Semin Nucl Med. 2008 May.

Abstract

Single-photon emission computed tomography/computed tomography (SPECT/CT) has emerged during the past decade as a means of correlating anatomical information from CT with functional information from SPECT. The integration of SPECT and CT in a single imaging device facilitates anatomical localization of the radiopharmaceutical to differentiate physiological uptake from that associated with disease and patient-specific attenuation correction to improve the visual quality and quantitative accuracy of the SPECT image. The first clinically available SPECT/CT systems performed emission-transmission imaging using a dual-headed SPECT camera and a low-power x-ray CT subsystem. Newer SPECT/CT systems are available with high-power CT subsystems suitable for detailed anatomical diagnosis, including CT coronary angiography and coronary calcification that can be correlated with myocardial perfusion measurements. The high-performance CT capabilities also offer the potential to improve compensation of partial volume errors for more accurate quantitation of radionuclide measurement of myocardial blood flow and other physiological processes and for radiation dosimetry for radionuclide therapy. In addition, new SPECT technologies are being developed that significantly improve the detection efficiency and spatial resolution for radionuclide imaging of small organs including the heart, brain, and breast, and therefore may provide new capabilities for SPECT/CT imaging in these important clinical applications.


Figures

Figure 1
Figure 1
Schematic of transmission-emission computer tomography system proposed by Mirshanov for simultaneous SPECT/CT with tandem semiconductor and scintillation strip detectors. (Figure from reference [227]).
Figure 2
Figure 2
Schematic of “Transmission/Emission Registered Imaging (TERI) Computed Tomography Scanner” proposed by Kaplan for simultaneous SPECT/CT imaging. (Figure from reference [44]).
Figure 3
Figure 3
(left) Schematic of data acquisition system for UCSF Emission-Transmission CT (ETCT) System. (Top right) Photograph of prototype ETCT system. (Bottom right) Transaxial image showing myocardial uptake of 99mTc-sestamibi SPECT image (red) superimposed on a gray-scale CT image of a porcine model of myocardial perfusion. (Figure on left, upper right, and bottom right reproduced with permission from references [46], [228], and [50], respectively.)
Figure 4
Figure 4
Prototype SPECT/CT system configured at UCSF from GE 9800 Quick CT system and single-detector GE XR/T SPECT system. Extended table and external table support allows both SPECT and CT imaging without removing patient from system. (Reproduced with permission from reference [229]).
Figure 5
Figure 5
Calibration of CT for x-ray derived attenuation coefficients performed with cylindrical phantom (left) containing different tissue equivalent materials. CT values (ie Hounsfield units) are correlated with values of linear attenuation coefficients (ie cm‐1) calculated from known composition of tissue equivalent materials calculated at energy of radionuclide used for emission imaging. Calibration curve (right) used to convert values in CT image to form patient-specific map of attenuation coefficients for attenuation correction of emission image (Reproduced with permission from reference [21]).
Figure 6
Figure 6
Images of 131I-metaiodobenzylguanidine (MIBG) of 7 year-old female with neuroblastoma with conventional SPECT (left) and CT (top right). SPECT image (middle right) and fused SPECT/CT image (bottom right) following compensation for photon attenuation and the geometrical response of the collimator (middle right). (Adapted and reproduced with permission from reference [32]).
Figure 7
Figure 7
99mTc-sestamibi SPECT scan of 66 year old male with atypical chest pain reconstructed using conventional filtered backprojection without attenuation correction (top) and using iterative reconstruction with x-ray based attenuation correction (bottom). Conventional perfusion SPECT showed defect in the inferior wall. Iterative reconstruction with attenuation correction produced a perfusion image which was read as being normal as was confirmed with coronary angiography. (Courtesy of General Electric Healthcare, Inc.)
Figure 8
Figure 8
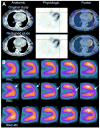
(A) Co-registered CT (top), SPECT (middle), and fused SPECT/CT (bottom) myocardial perfusion images with 99mTc-sestamibi. Top row shows images with misalignment of SPECT/CT images. Bottom row show SPECT/CT images following registration using vendor-supplied software. (b) Vertical long-axis slices of 99mTc-sestamibi images without attenuation correction (IRNC), with attenuation correction of original data (IRAC), and with attenuation correction following correction for spatial misalignment (IRAC-MC). Defects in apical anterior wall of original attenuation-corrected SPECT images are not apparent in uncorrected SPECT images and in attenuation corrected SPECT images following correction for misalignment. (Reproduced with permission from reference [62]).
Figure 9
Figure 9
Clinical SPECT/CT systems in 2007. (Top) GE Infinia Hawkeye; (Bottom left) Siemens Symbia; (Bottom right) Philips Precedence (Courtesy of GE Healthcare, Inc., Siemens Medical Solutions, Inc., Philips Medical Systems, Inc.)
Figure 10
Figure 10
Lymphoscintigraphy for sentinel node detection of patient with primary breast carcinoma. SPECT/CT study demonstrates two sentinel lymph nodes in the axilla adjacent to the trapezius and pectoralis major muscles. Volume rendering of fused datasets from thin slice spiral CT and SPECT demonstrate positions of the sentinel nodes in preparation of surgical planning for node removal. (Courtesy of Siemens Medical Solutions, Inc.)
Figure 11
Figure 11
CT coronary angiography (CTCA) and 99mTc-sestamibi stress/201Tl rest SPECT images with x-ray based attenuation correction. Study performed with 16-slice CT scanner and dual-head variable-angle SPECT system with shared patient table to spatially register images from patient with coronary artery bypass graft. (Top left) Curved multiplanar re-formats of CTCA data shows severe irregular stenosis (solid white arrow), patient stent (black arrow), and patent diagonal artery distal to anastomosis with saphenous vein graft (dotted white arrow). (Top right) Cardiac perfusion SPECT study at stress (first and third rows) and rest (second and forth rows) shows reversible perfusion defect in the anterolateral wall (arrows) consistent with myocardial ischemia. (Bottom) Surface rendered image showing myocardial perfusion from SPECT study fused on left ventricular surface with native left coronary tree. At bottom left, decreased perfusion in the anterolateral wall (blue region, arrow) corresponds to region of first diagonal artery (arrow head). Fused data (bottom right) shows normal perfusion at rest in the same area (dotted arrow). The fused SPECT/CTCA image is consistent with myocardial ischemia related to a tight, irregular stenosis of the proximal saphenous vein graft to the first diagonal artery. LAD indicates left anterior descending coronary; D1, first diagonal branch; R, ramus intermedius coronary; and LCX, left circumflex coronary. (Adapted and reproduced permission of reference [115].)
Figure 12
Figure 12
99mTc-sestamibi myocardial perfusion images obtained with conventional SPECT (top) and with novel high-efficiency “D-SPECT” system (bottom) using 99mTc-sestamibi stress/rest gated protocol. High-dose (first row) and low-dose (second row) images acquired with 28 mCi and 10 mCi respectively of 99mTc-sestamibi, and required 16 min and 20 min with conventional SPECT versus 4 min and 2 min with D-SPECT. Conventional SPECT interpreted as having reversible inferior wall defect. D-SPECT interpreted as normal and was confirmed by coronary angiography. (Courtesy of Spectrum Dynamics, Ltd.)

References

    1. Cherry SR, Sorenson JA, Phelps ME. Physics in Nuclear Medicine. Philadelphia: Saunders; 2003.
    1. Jaszczak RJ, Coleman RE, Lim CB. SPECT: Single photon emission computed tomography. IEEE Tran Nucl Sci. 1980;NS-27:1137–1153.
    1. Loats H. CT and SPECT image registration and fusion for spatial localization of metastatic processes using radiolabeled monoclonals. J Nucl Med. 1993;34:562–566. - PubMed
    1. Maintz JB, Viergever MA. A survey of medical image registration. Med Image Anal. 1998;2:1–36. - PubMed
    1. Hill DL, Batchelor PG, Holden M, Hawkes DJ. Medical image registration. Phys Med Biol. 2001;46:R1–45. - PubMed

Publication types

MeSH terms

Substances