

Low-frequency and high-frequency distortion product otoacoustic emission suppression in humans
- PMID: 18397024
- PMCID: PMC2562758
- DOI: 10.1121/1.2839138
Low-frequency and high-frequency distortion product otoacoustic emission suppression in humans
Abstract
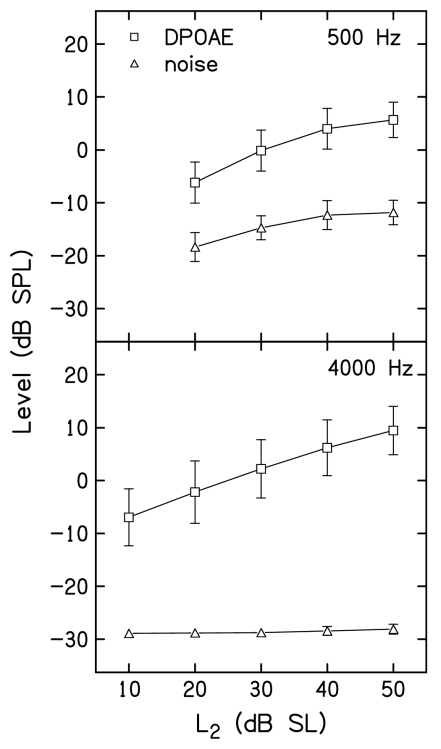
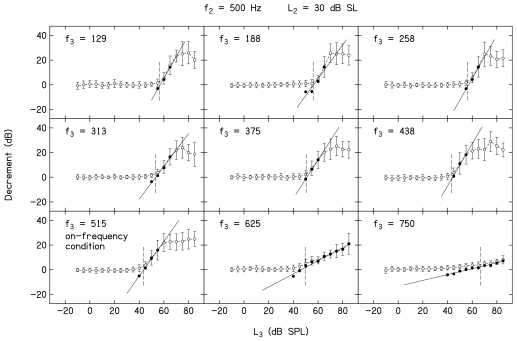
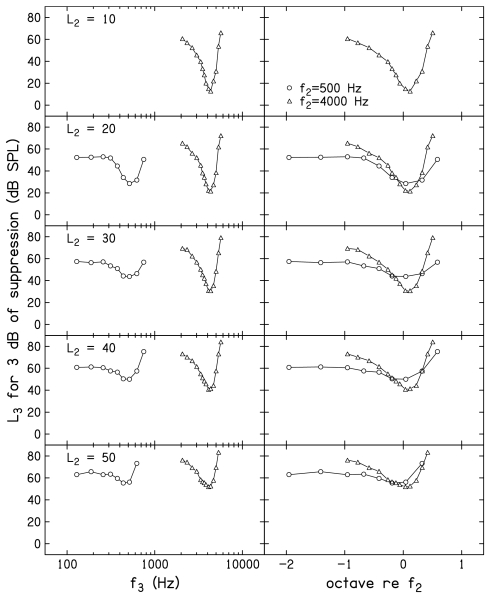
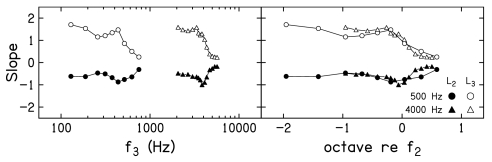
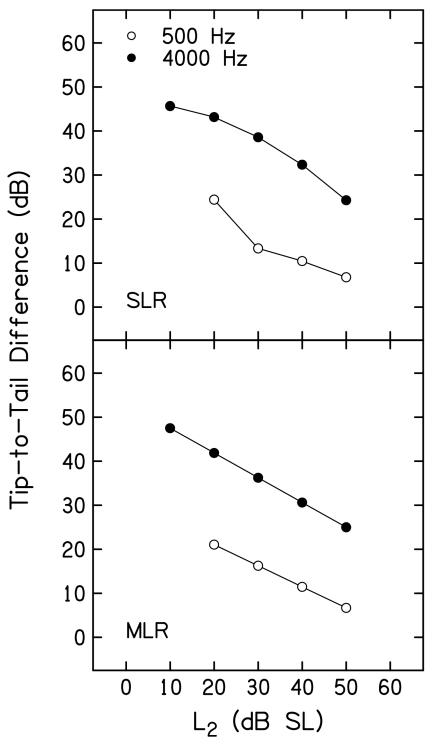
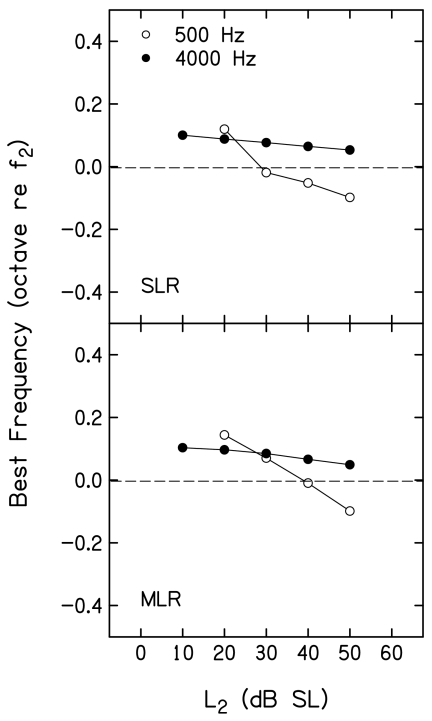
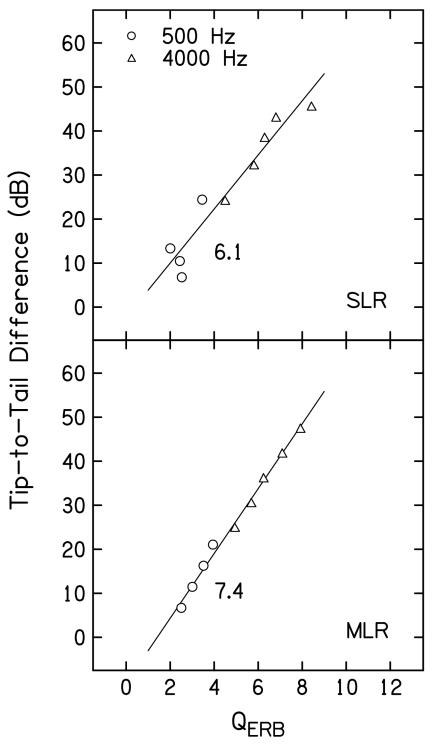
Distortion product otoacoustic emission suppression (quantified as decrements) was measured for f(2)=500 and 4000 Hz, for a range of primary levels (L(2)), suppressor frequencies (f(3)), and suppressor levels (L(3)) in 19 normal-hearing subjects. Slopes of decrement-versus-L(3) functions were similar at both f(2) frequencies, and decreased as f(3) increased. Suppression tuning curves, constructed from decrement functions, were used to estimate (1) suppression for on- and low-frequency suppressors, (2) tip-to-tail differences, (3) Q(ERB), and (4) best frequency. Compression, estimated from the slope of functions relating suppression "threshold" to L(2) for off-frequency suppressors, was similar for 500 and 4000 Hz. Tip-to-tail differences, Q(ERB), and best frequency decreased as L(2) increased for both frequencies. However, tip-to-tail difference (an estimate of cochlear-amplifier gain) was 20 dB greater at 4000 Hz, compared to 500 Hz. Q(ERB) decreased to a greater extent with L(2) when f(2)=4000 Hz, but, on an octave scale, best frequency shifted more with level when f(2)=500 Hz. These data indicate that, at both frequencies, cochlear processing is nonlinear. Response growth and compression are similar at the two frequencies, but gain is greater at 4000 Hz and spread of excitation is greater at 500 Hz.
Figures


Similar articles
-
Distortion-product otoacoustic emission suppression tuning curves in humans.J Acoust Soc Am. 2011 Feb;129(2):817-27. doi: 10.1121/1.3531864. J Acoust Soc Am. 2011. PMID: 21361440 Free PMC article.
-
Temporal aspects of suppression in distortion-product otoacoustic emissions.J Acoust Soc Am. 2011 May;129(5):3082-9. doi: 10.1121/1.3575553. J Acoust Soc Am. 2011. PMID: 21568411 Free PMC article.
-
Distortion product otoacoustic emission suppression tuning curves in normal-hearing and hearing-impaired human ears.J Acoust Soc Am. 2003 Jul;114(1):263-78. doi: 10.1121/1.1575751. J Acoust Soc Am. 2003. PMID: 12880040
-
Compression estimates using behavioral and otoacoustic emission measures.Hear Res. 2005 Mar;201(1-2):44-54. doi: 10.1016/j.heares.2004.10.006. Hear Res. 2005. PMID: 15721560
-
Distortion-product otoacoustic emission suppression tuning curves in hearing-impaired humans.J Acoust Soc Am. 2012 Nov;132(5):3292-304. doi: 10.1121/1.4754525. J Acoust Soc Am. 2012. PMID: 23145613 Free PMC article.
Cited by
-
Distortion product emissions from a cochlear model with nonlinear mechanoelectrical transduction in outer hair cells.J Acoust Soc Am. 2010 Apr;127(4):2420-32. doi: 10.1121/1.3337233. J Acoust Soc Am. 2010. PMID: 20370025 Free PMC article.
-
Distortion-product otoacoustic emission suppression tuning curves in humans.J Acoust Soc Am. 2011 Feb;129(2):817-27. doi: 10.1121/1.3531864. J Acoust Soc Am. 2011. PMID: 21361440 Free PMC article.
-
Distortion-product otoacoustic emission input/output characteristics in normal-hearing and hearing-impaired human ears.J Acoust Soc Am. 2009 Aug;126(2):728-38. doi: 10.1121/1.3158859. J Acoust Soc Am. 2009. PMID: 19640039 Free PMC article.
-
Growth of suppression in humans based on distortion-product otoacoustic emission measurements.J Acoust Soc Am. 2011 Feb;129(2):801-6. doi: 10.1121/1.3523287. J Acoust Soc Am. 2011. PMID: 21361439 Free PMC article.
-
Temporal aspects of suppression in distortion-product otoacoustic emissions.J Acoust Soc Am. 2011 May;129(5):3082-9. doi: 10.1121/1.3575553. J Acoust Soc Am. 2011. PMID: 21568411 Free PMC article.
References
-
- American National Standards Institute (1996). “Specifications for audiometers,” ANSI S3.6-1996, New York.
Publication types
MeSH terms
Grants and funding
LinkOut - more resources
Full Text Sources
Miscellaneous