. 2008 Apr 8;9(4):R69.
doi: 10.1186/gb-2008-9-4-r69.

Natural selection of protein structural and functional properties: a single nucleotide polymorphism perspective

Affiliations

Natural selection of protein structural and functional properties: a single nucleotide polymorphism perspective

Jinfeng Liu et al. Genome Biol. .

Abstract

Background: The rates of molecular evolution for protein-coding genes depend on the stringency of functional or structural constraints. The Ka/Ks ratio has been commonly used as an indicator of selective constraints and is typically calculated from interspecies alignments. Recent accumulation of single nucleotide polymorphism (SNP) data has enabled the derivation of Ka/Ks ratios for polymorphism (SNP A/S ratios).

Results: Using data from the dbSNP database, we conducted the first large-scale survey of SNP A/S ratios for different structural and functional properties. We confirmed that the SNP A/S ratio is largely correlated with Ka/Ks for divergence. We observed stronger selective constraints for proteins that have high mRNA expression levels or broad expression patterns, have no paralogs, arose earlier in evolution, have natively disordered regions, are located in cytoplasm and nucleus, or are related to human diseases. On the residue level, we found higher degrees of variation for residues that are exposed to solvent, are in a loop conformation, natively disordered regions or low complexity regions, or are in the signal peptides of secreted proteins. Our analysis also revealed that histones and protein kinases are among the protein families that are under the strongest selective constraints, whereas olfactory and taste receptors are among the most variable groups.

Conclusion: Our study suggests that the SNP A/S ratio is a robust measure for selective constraints. The correlations between SNP A/S ratios and other variables provide valuable insights into the natural selection of various structural or functional properties, particularly for human-specific genes and constraints within the human lineage.


Figures

Figure 1
Figure 1
The SNP A/S ratio is a good measure for evolutionary constraints. Error bars represent 95th percentile confidence intervals from bootstrap resampling. (a) SNP A/S ratios correlate with Ka/Ks ratios from human-mouse alignments. Proteins were grouped into bins of equal intervals (interval = 0.05) according to their Ka/Ks ratios, and the SNP A/S ratio was calculated for each bin. (b) SNP A/S ratios correlate negatively with residue conservation scores from protein sequence alignments. All residues were grouped into bins of equal intervals (interval = 0.5) according to their position specific alignment information taken from PSI-BLAST alignment profiles, and the SNP A/S ratio was obtained for each bin.
Figure 2
Figure 2
Correlation between SNP A/S ratios and expression parameters. Genes were grouped into bins of roughly nine equal intervals according to several expression measurements from a microarray experiment, and the SNP A/S ratio was obtained for each bin. Error bars represent 95th percentile confidence intervals from bootstrap resampling. (a) Negative correlation between SNP A/S ratios and mean mRNA expression levels. (b) Negative correlation between SNP A/S ratios and peak mRNA expression levels. (c) Negative correlation between SNP A/S ratios and expression breadth. (d) No correlation between SNP A/S ratios and expression tissue specificity.
Figure 3
Figure 3
SNP A/S ratios and evolutionary variables. (a) Proteins with paralogs (167 proteins) are under weaker selective pressure than proteins without paralogs (12,460 proteins). The 95th percentile confidence intervals of the A/S ratio are [0.38, 0.58] for proteins with paralogs, and [0.26, 0.27] for proteins without paralogs (dark gray bars). To control for expression breadth, the subset of proteins with mRNA expression data were analyzed (65 proteins with paralogs and 10,612 without, light gray bars) and Monte Carlo samplings were performed so that the two groups had the same distribution of expression breadth. The differences in A/S ratios are significant both before (light gray bars) and after (white bars) controlling for expression. (b) Proteins that arose early in evolution are subject to stronger evolutionary constraints.
Figure 4
Figure 4
Evolutionary constraints on protein sequence and structure features. Error bars represent 95th percentile confidence intervals from bootstrap resampling. (a) For proteins shorter than 500 residues, short proteins have high A/S ratios. (b) Buried residues are under stronger selection. The 95th percentile confidence intervals of the A/S ratio are [0.23, 0.25] for buried residues, and [0.30, 0.32] for exposed residues. (c) Loop residues have relaxed evolutionary constraints. The 95th percentile confidence intervals of the A/S ratio are [0.25, 0.26] for residues in alpha-helices, [0.24, 0.27] for residues in beta-strands, and [0.30, 0.32] for residues in loops. (d) Proteins with disordered regions are more conserved, while disordered residues are under lower selective pressure. (e) Residues in low complexity regions evolve faster.
Figure 5
Figure 5
Selective pressures on protein subcellular localization. Error bars represent 95th percentile confidence intervals from bootstrap resampling. (a) Analysis of SignalP predictions suggests that while there is no significant difference in selective pressure between secreted and non-secreted proteins, residues within signal peptides are evolving faster. (b) TMHMM predictions show no difference in A/S ratios between membrane proteins and non-membrane proteins, transmembrane segments and non-transmembrane segments. (c) LOCtree predictions of protein subcellular localization indicate extracellular proteins (1,587 proteins) are under more relaxed selective pressure than cytoplasmic proteins (2,105) and nuclear proteins (5,431). (d) GO cellular component annotations suggest extracellular proteins (522 proteins) are under more relaxed selective pressure than cytoplasmic proteins (1,030) and nuclear proteins (1,961), while membrane proteins (2,715) fall in between. The 95th percentile confidence intervals of the A/S ratio are [0.27, 0.33] for extracellular proteins, [0.21, 0.24] for nuclear proteins, [0.22, 0.26] for cytoplasmic proteins, and [0.26, 0.29] for membrane proteins.
Figure 6
Figure 6
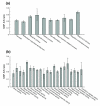
Evolutionary constraints on protein functional categories. Error bars represent 95th percentile confidence intervals from bootstrap resampling. GO annotations were extracted for each protein, and the GO terms were mapped to high level GOA slim terms for (a) biological process and (b) molecular function. SNP A/S ratios were then calculated for each group.
Figure 7
Figure 7
Disease-related genes are under stronger selective pressure. Disease related genes were obtained from CGC (243 genes), COSMIC (3,103 genes), and OMIM (2,334 genes) databases. The SNP A/S ratio was calculated for each group. The 95th percentile confidence intervals from bootstrap resampling (shown as error bars) are [0.19, 0.27] for CGC, [0.20, 0.22] for COSMIC, [0.23, 0.26] for OMIM, and [0.31, 0.33] for others.
Figure 8
Figure 8
Selective pressures on connectivity in protein-protein interaction networks. Error bars represent 95th percentile confidence intervals from bootstrap resampling. (a) Proteins with more interaction partners appear to have lower A/S ratios (gray bars); however, for yeast two-hybrid interactions, the differences are less significant for proteins with at least one interaction partner (white bars). (b) Proteins with more interaction partners tend to have higher mRNA expression levels (gray bars). This could result from experimental bias: for yeast two-hybrid interactions, the differences are not significant for proteins with at least one interaction partner (white bars).
Figure 9
Figure 9
The SNP A/S ratio negatively correlates with the proportion of coding sequence (CDS) within 70 bp of an exon-intron junction. Genes were grouped into bins of nine equal intervals according to the proportion of sequence within 70 bp of an exon-intron junction, and the SNP A/S ratio was obtained for each bin. Error bars represent 95th percentile confidence intervals from bootstrap resampling.

References

    1. Hurst LD. The Ka/Ks ratio: diagnosing the form of sequence evolution. Trends Genet. 2002;18:486. doi: 10.1016/S0168-9525(02)02722-1. - DOI - PubMed
    1. Li W-H. Molecular Evolution. Sunderland, Massachusetts: Sinauer Associates, Inc.; 1997.
    1. Jordan IK, Rogozin IB, Wolf YI, Koonin EV. Essential genes are more evolutionarily conserved than are nonessential genes in bacteria. Genome Res. 2002;12:962–968. doi: 10.1101/gr.87702. Article published online before print in May 2002. - DOI - PMC - PubMed
    1. Zhang L, Li WH. Mammalian housekeeping genes evolve more slowly than tissue-specific genes. Mol Biol Evol. 2004;21:236–239. doi: 10.1093/molbev/msh010. - DOI - PubMed
    1. Mouse Genome Sequencing Consortium. Waterston RH, Lindblad-Toh K, Birney E, Rogers J, Abril JF, Agarwal P, Agarwala R, Ainscough R, Alexandersson M, An P, Antonarakis SE, Attwood J, Baertsch R, Bailey J, Barlow K, Beck S, Berry E, Birren B, Bloom T, Bork P, Botcherby M, Bray N, Brent MR, Brown DG, Brown SD, Bult C, Burton J, Butler J, Campbell RD, Carninci P. et al.Initial sequencing and comparative analysis of the mouse genome. Nature. 2002;420:520–562. doi: 10.1038/nature01262. - DOI - PubMed

LinkOut - more resources