. 2008 Apr 9;9(4):R70.
doi: 10.1186/gb-2008-9-4-r70.

Molecular signature of hypersaline adaptation: insights from genome and proteome composition of halophilic prokaryotes

Affiliations

Molecular signature of hypersaline adaptation: insights from genome and proteome composition of halophilic prokaryotes

Sandip Paul et al. Genome Biol. .

Abstract

Background: Halophilic prokaryotes are adapted to thrive in extreme conditions of salinity. Identification and analysis of distinct macromolecular characteristics of halophiles provide insight into the factors responsible for their adaptation to high-salt environments. The current report presents an extensive and systematic comparative analysis of genome and proteome composition of halophilic and non-halophilic microorganisms, with a view to identify such macromolecular signatures of haloadaptation.

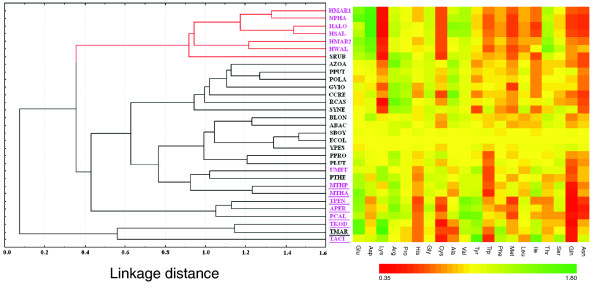
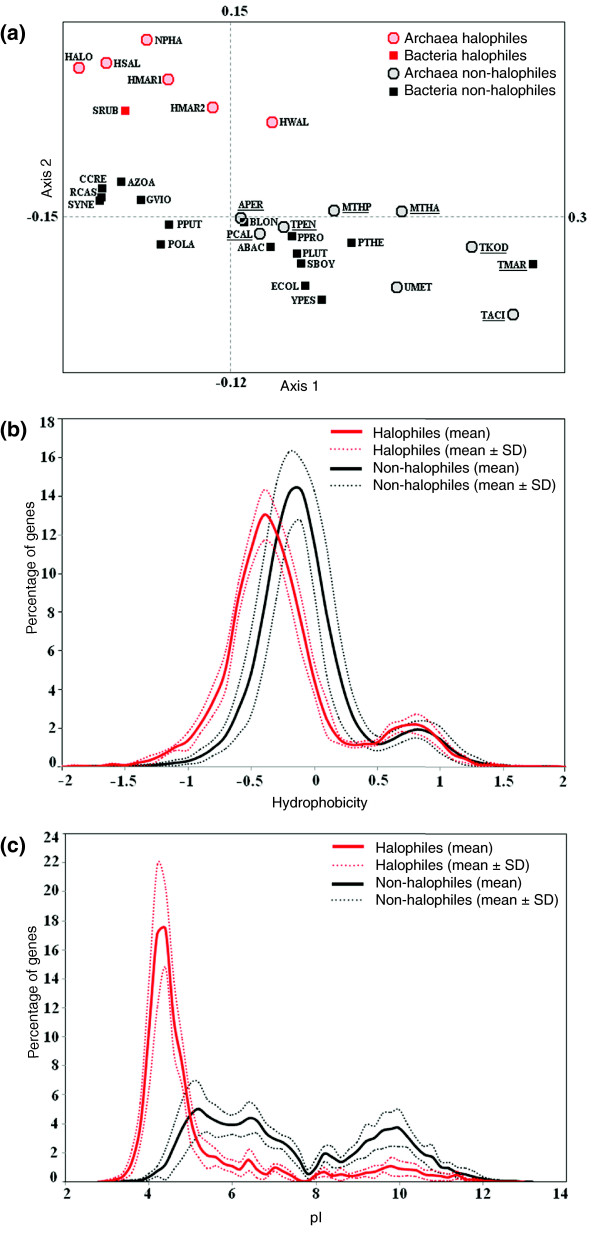
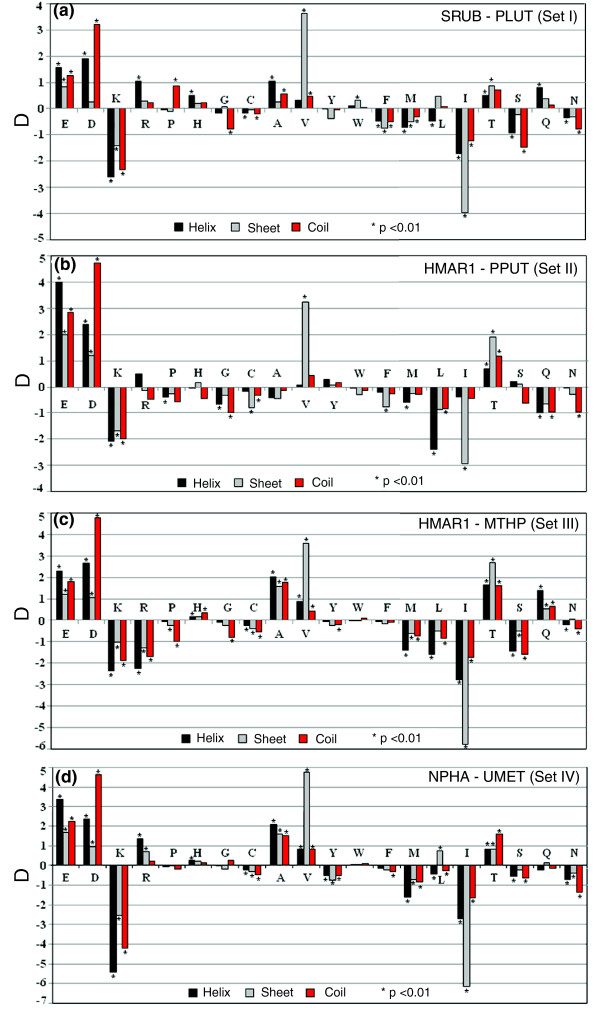
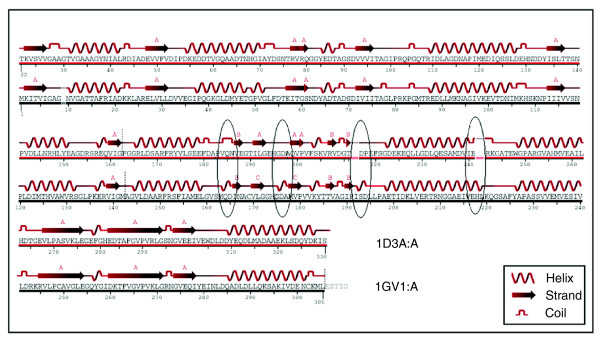
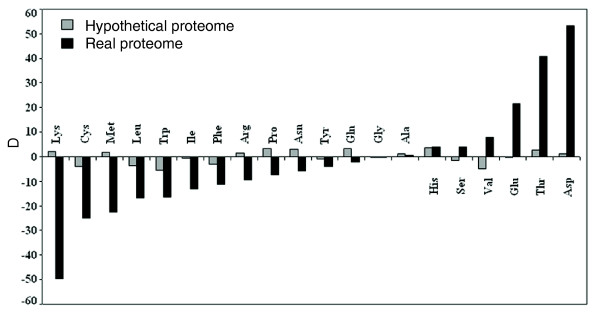
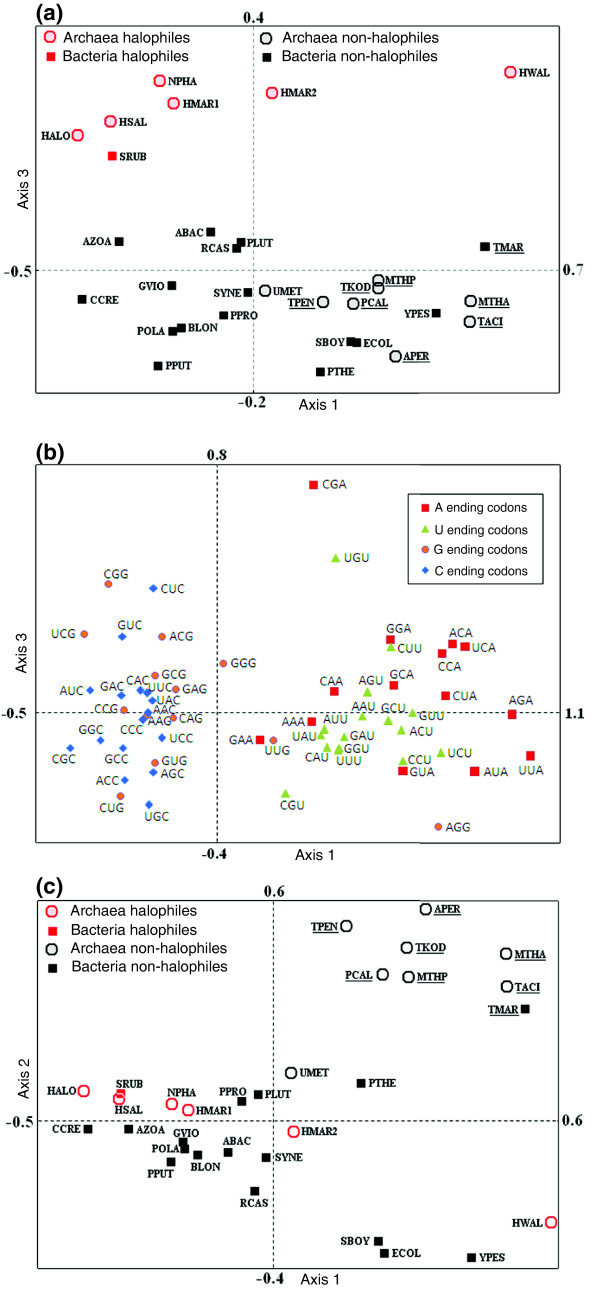
Results: Comparative analysis of the genomes and proteomes of halophiles and non-halophiles reveals some common trends in halophiles that transcend the boundary of phylogenetic relationship and the genomic GC-content of the species. At the protein level, halophilic species are characterized by low hydrophobicity, over-representation of acidic residues, especially Asp, under-representation of Cys, lower propensities for helix formation and higher propensities for coil structure. At the DNA level, the dinucleotide abundance profiles of halophilic genomes bear some common characteristics, which are quite distinct from those of non-halophiles, and hence may be regarded as specific genomic signatures for salt-adaptation. The synonymous codon usage in halophiles also exhibits similar patterns regardless of their long-term evolutionary history.

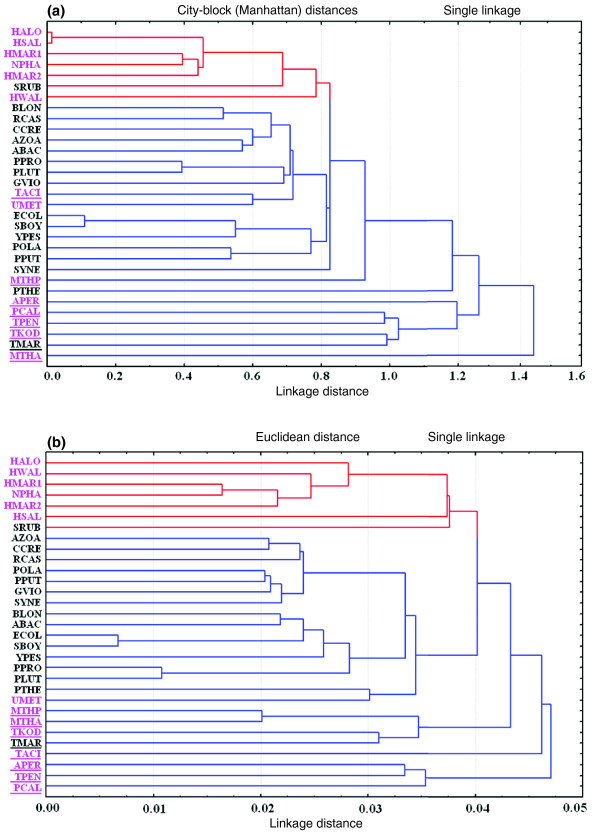
Conclusion: The generality of molecular signatures for environmental adaptation of extreme salt-loving organisms, demonstrated in the present study, advocates the convergent evolution of halophilic species towards specific genome and amino acid composition, irrespective of their varying GC-bias and widely disparate taxonomic positions. The adapted features of halophiles seem to be related to physical principles governing DNA and protein stability, in response to the extreme environmental conditions under which they thrive.


Figures

Figure 1
Figure 1
Grouping of halophiles and non-halophiles according to their standardized amino acid usage. Standardized amino acid composition of halophiles and non-halophiles grouped by unweighted pair group average clustering. The left panel depicts the unweighted pair group average clustering on the relative abundances of different amino acid residues in the encoded proteins of organisms with respect to those of E. coli. The distance in the clustering is Euclidean distance. The right panel is a pictorial representation of relative amino acid usage in the respective organisms. The over-representation or under-representation of amino acid residues in the organisms are shown in green and red colored blocks, respectively. Archaeal species are denoted in pink color and the species adapted to high temperature (optimum growth temperature ≥ 65°C) are underlined. Organism abbreviations are listed in Table 1.
Figure 2
Figure 2
COA on amino acid usage and frequency distribution of genes on hydrophobicity and pI. (a) Positions of 24 non-halophiles and 6 halophiles on the plane defined by first and second major axes generated from COA on amino acid usage of encoded proteins. High temperature adapted organisms are underlined. (b) Distribution of genes on the basis of hydrophobicity of encoded proteins. (c) Distribution of genes on the basis of predicted pI of encoded proteins. Red and black color indicates halophiles and non-halophiles, respectively. Organism abbreviations are listed in Table 1.
Figure 3
Figure 3
Variations in amino acid content of different secondary structural regions. The differences in the contributions of individual amino acids to secondary structural regions in orthologous proteins from (a) S. ruber and P. luteolum (set I), (b) H. marismortui chromosome I and P. putida (set II), (c) H. marismortui chromosome I and M. thermophila (set III) and (d) N. pharaonis and methanogenic archaeon (set IV). The differences were derived as D = (Frequency of halophile amino acid residue - Frequency of non-halophile amino acid residue). Black, grey and red bars indicate helix, sheet and coil regions, respectively, and asterisks indicates significant differences at p < 10-2. Organism abbreviations are listed in Table 1.
Figure 4
Figure 4
Secondary structural comparison. Comparison of secondary structured regions of crystal structures calculated by DSSP for aligned orthologous sequences of MDH proteins from H. marismortui (1D3A) and C. vibrioforme (1GV1). Changes in secondary structures in aligned regions of non-halophile (black line) and halophile (red line) protein are marked by ovals whereas gapped regions are marked by dotted lines.
Figure 5
Figure 5
Average amino acid composition of real and hypothetical proteomes. Differences between average amino acid composition of real proteomes (black bars) and hypothetical proteomes simulated from reshuffled DNA (gray bars) of halophilic and non-halophilic organisms. The differences were derived as D = [(Avgerage halophilic/Avgerage nonhalophilic) -1] × 100.
Figure 6
Figure 6
Clustering on dinucleotide values. (a) Clustering on dinucleotide abundance values of the genomes of all the organisms under study by city-block (Manhattan) distance. (b) Clustering made by dinucleotide frequencies at the first and second codon positions of genes for all organisms under study. The distance in the clustering is Euclidean distance. Red and blue lines signify halophilic and non-halophilic organisms, respectively. Archaeal species are written in pink and the species adapted to high temperature are underlined. Organism abbreviations are listed in Table 1.
Figure 7
Figure 7
Correspondence analysis on RSCU. (a) Position of 24 non-halophiles and 6 halophiles along the first and third principal axes generated by COA on actual RSCU values of 82,927 predicted ORFs. High temperature adapted organisms are underlined. (b) Distribution of synonymous codons along the first and third principal axes of the COA on RSCU values of the genes of 82,927 predicted ORFs of 24 non-halophilic and 6 halophilic chromosomes. (c) Position of 24 non-halophiles and 6 halophiles along the first two principal axes generated by COA on actual RSCU values of 82,927 predicted ORFs. Species adapted to high temperature are underlined. Organism abbreviations are listed in Table 1.

Similar articles

Cited by

References

    1. Eisenberg H. Life in unusual environments: progress in understanding the structure and function of enzymes from extreme halophilic bacteria. Arch Biochem Biophys. 1995;318:1–5. doi: 10.1006/abbi.1995.1196. - DOI - PubMed
    1. Eisenberg H, Mevarech M, Zaccai G. Biochemical, structural, and molecular genetic aspects of halophilism. Adv Protein Chem. 1992;43:1–62. - PubMed
    1. Galinsky EA, Trüper HG. Microbial behaviour in salt-stressed ecosystems. FEMS Microbiol Rev. 1994;15:95–108. doi: 10.1111/j.1574-6976.1994.tb00128.x. - DOI
    1. Lanyi JK. Salt-dependent properties of proteins from extremely halophilic bacteria. Bacteriol Rev. 1974;38:272–290. - PMC - PubMed
    1. Mongodin EF, Nelson KE, Daugherty S, Deboy RT, Wister J, Khouri H, Weidman J, Walsh DA, Papke RT, Sanchez Perez G, Sharma AK, Nesbo CL, MacLeod D, Bapteste E, Doolittle WF, Charlebois RL, Legault B, Rodriguez-Valera F. The genome of Salinibacter ruber : convergence and gene exchange among hyperhalophilic bacteria and archaea. Proc Natl Acad Sci USA. 2005;102:18147–18152. doi: 10.1073/pnas.0509073102. - DOI - PMC - PubMed

Publication types

LinkOut - more resources