

Effect of lower targets for blood pressure and LDL cholesterol on atherosclerosis in diabetes: the SANDS randomized trial
- PMID: 18398080
- PMCID: PMC4243925
- DOI: 10.1001/jama.299.14.1678
Effect of lower targets for blood pressure and LDL cholesterol on atherosclerosis in diabetes: the SANDS randomized trial
Abstract
Context: Individuals with diabetes are at increased risk for cardiovascular disease (CVD), but more aggressive targets for risk factor control have not been tested.
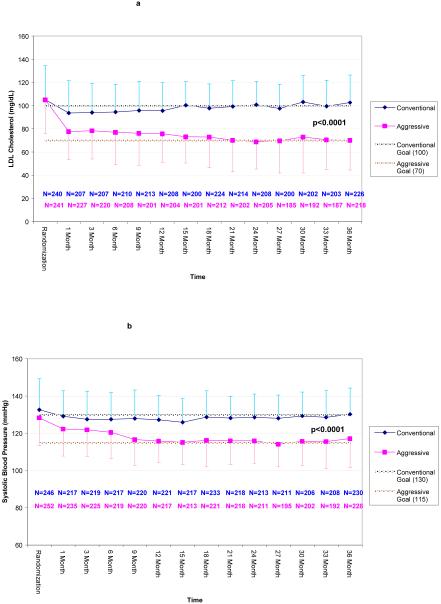
Objective: To compare progression of subclinical atherosclerosis in adults with type 2 diabetes treated to reach aggressive targets of low-density lipoprotein cholesterol (LDL-C) of 70 mg/dL or lower and systolic blood pressure (SBP) of 115 mm Hg or lower vs standard targets of LDL-C of 100 mg/dL or lower and SBP of 130 mm Hg or lower.
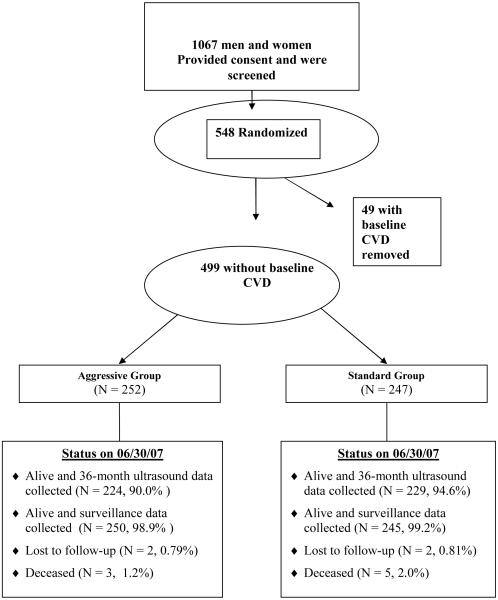
Design, setting, and participants: A randomized, open-label, blinded-to-end point, 3-year trial from April 2003-July 2007 at 4 clinical centers in Oklahoma, Arizona, and South Dakota. Participants were 499 American Indian men and women aged 40 years or older with type 2 diabetes and no prior CVD events.
Interventions: Participants were randomized to aggressive (n=252) vs standard (n=247) treatment groups with stepped treatment algorithms defined for both.
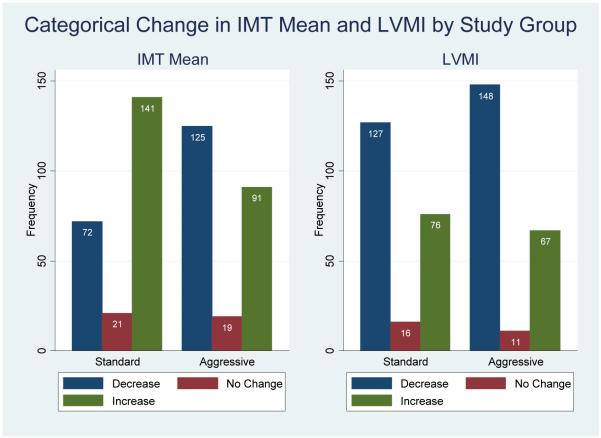
Main outcome measures: Primary end point was progression of atherosclerosis measured by common carotid artery intimal medial thickness (IMT). Secondary end points were other carotid and cardiac ultrasonographic measures and clinical events.
Results: Mean target LDL-C and SBP levels for both groups were reached and maintained. Mean (95% confidence interval) levels for LDL-C in the last 12 months were 72 (69-75) and 104 (101-106) mg/dL and SBP levels were 117 (115-118) and 129 (128-130) mm Hg in the aggressive vs standard groups, respectively. Compared with baseline, IMT regressed in the aggressive group and progressed in the standard group (-0.012 mm vs 0.038 mm; P < .001); carotid arterial cross-sectional area also regressed (-0.02 mm(2) vs 1.05 mm(2); P < .001); and there was greater decrease in left ventricular mass index (-2.4 g/m(2.7) vs -1.2 g/m(2.7); P = .03) in the aggressive group. Rates of adverse events (38.5% and 26.7%; P = .005) and serious adverse events (n = 4 vs 1; P = .18) related to blood pressure medications were higher in the aggressive group. Clinical CVD events (1.6/100 and 1.5/100 person-years; P = .87) did not differ significantly between groups.
Conclusions: Reducing LDL-C and SBP to lower targets resulted in regression of carotid IMT and greater decrease in left ventricular mass in individuals with type 2 diabetes. Clinical events were lower than expected and did not differ significantly between groups. Further follow-up is needed to determine whether these improvements will result in lower long-term CVD event rates and costs and favorable risk-benefit outcomes.
Trial registration: clinicaltrials.gov Identifier: NCT00047424.
Figures
Comment in
-
The great debate of 2008--how low to go in preventive cardiology?JAMA. 2008 Apr 9;299(14):1718-20. doi: 10.1001/jama.299.14.1718. JAMA. 2008. PMID: 18398086 No abstract available.
-
Oral hypoglycemic use and the SANDS trial.JAMA. 2008 Jul 23;300(4):389; author reply 389-90. doi: 10.1001/jama.300.4.389-a. JAMA. 2008. PMID: 18647976 No abstract available.
-
Diabetes Control and Cardiovascular Risk: ACCORD, ADVANCE, AVOID, and SANDS.Prev Cardiol. 2008 Fall;11(4):230-6. doi: 10.1111/j.1751-7141.2008.00006.x. Prev Cardiol. 2008. PMID: 19476576 No abstract available.
References
-
- Kannel WB, McGee DL. Diabetes and glucose tolerance as risk factors for cardiovascular disease: The Framingham Study. Diabetes Care. 1979;2:120–126. - PubMed
-
- Kleinman JC, Donahue RP, Harris MI, et al. Mortality among diabetics in a national sample. Am J Epidemiol. 1988;128:389–401. - PubMed
-
- Butler WJ, Ostrander LD, Can11an WJ, et al. Mortality from coronary heart disease in the Tecumseh Study: Long-term effect of diabetes mellitus, glucose tolerance and other risk factors. Am J Epidemiol. 1985;121:541–547. - PubMed
-
- Howard BV. Macrovascular complications of diabetes mellitus. In: LeRoith D, Taylor SI, Olefs JM, editors. Diabetes Mellitus. Lippincott-Raven; Philadelphia: 1996. pp. 792–797.
-
- Klein R. Kelly West Lecture 1994: Hyperglycemia and microvascular and macrovascular disease in diabetes. Diabetes Care. 1995;18:258–268. - PubMed
Publication types
MeSH terms
Substances
Associated data
Grants and funding
LinkOut - more resources
Full Text Sources
Medical
Miscellaneous
