. 2006 Dec;35(4-6):207-28.
doi: 10.1007/s11068-008-9019-6. Epub 2008 Apr 5.

Imaging synaptic inhibition in transgenic mice expressing the chloride indicator, Clomeleon

Affiliations

Imaging synaptic inhibition in transgenic mice expressing the chloride indicator, Clomeleon

Ken Berglund et al. Brain Cell Biol. 2006 Dec.

Abstract

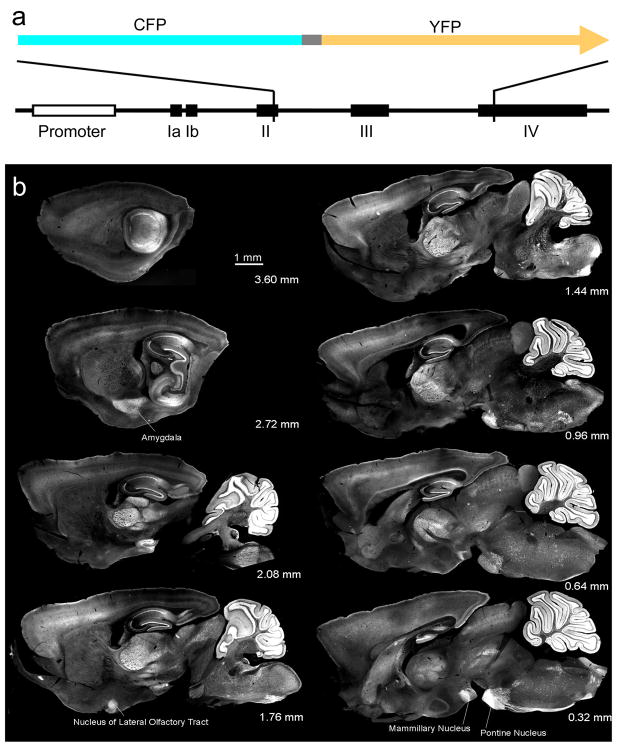
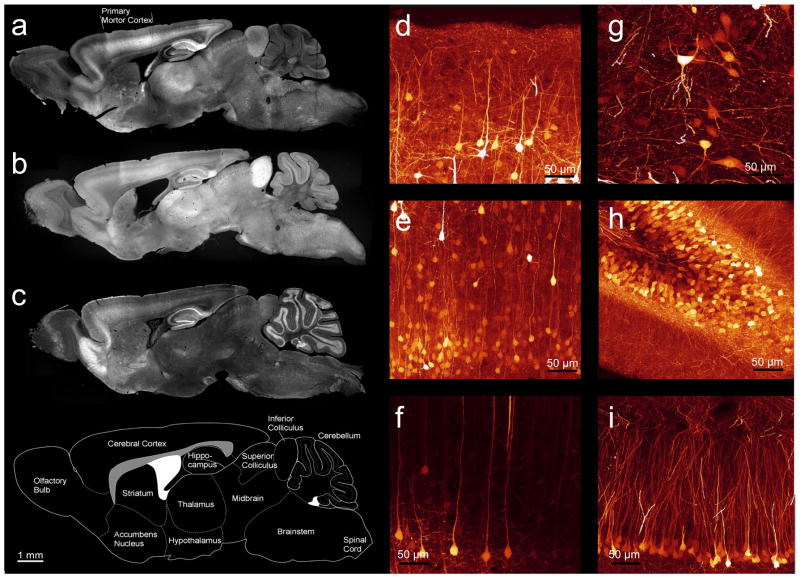
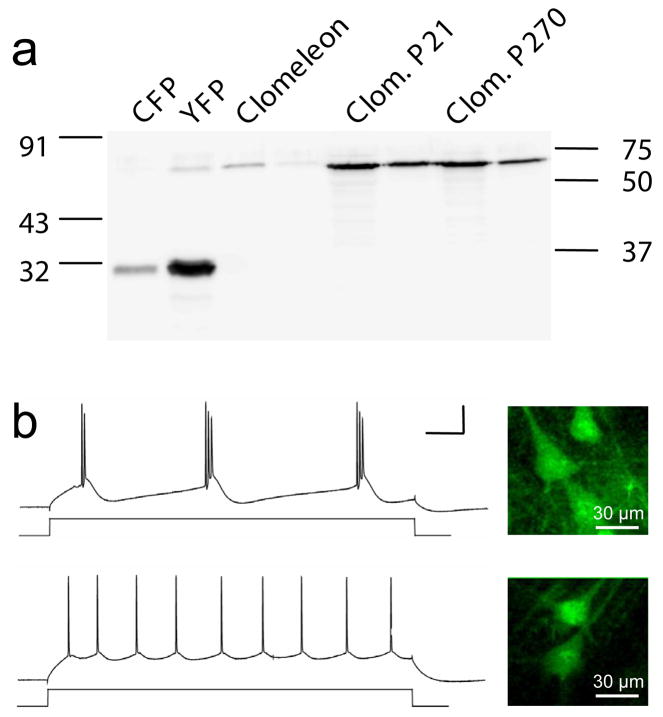
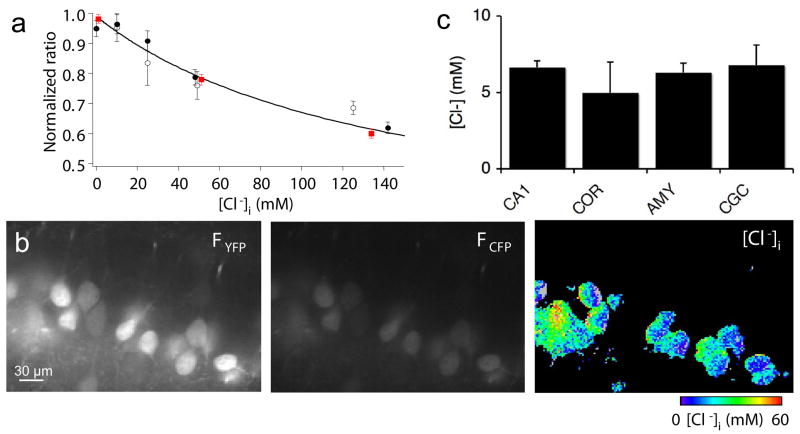
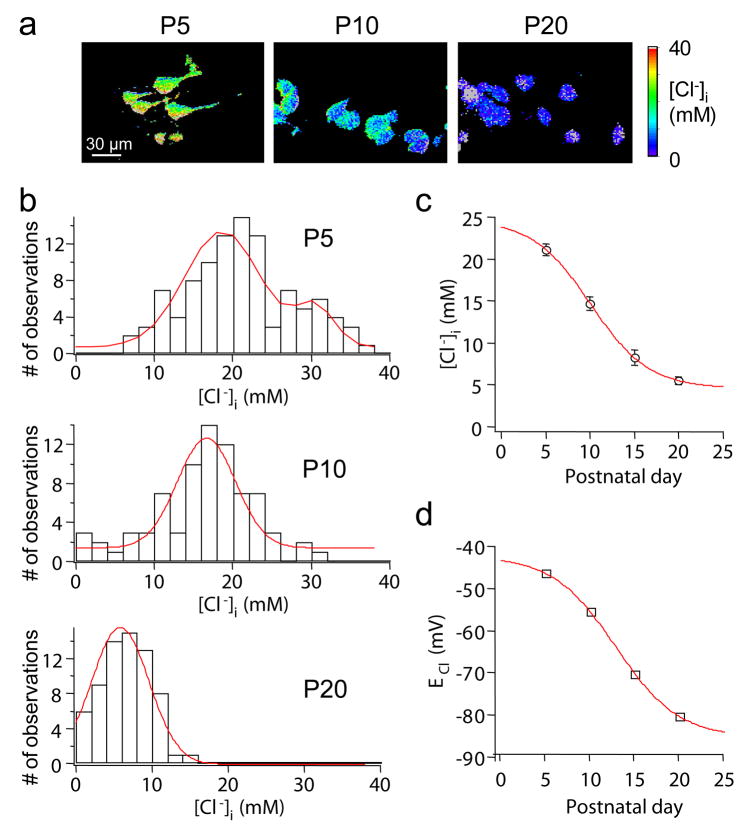
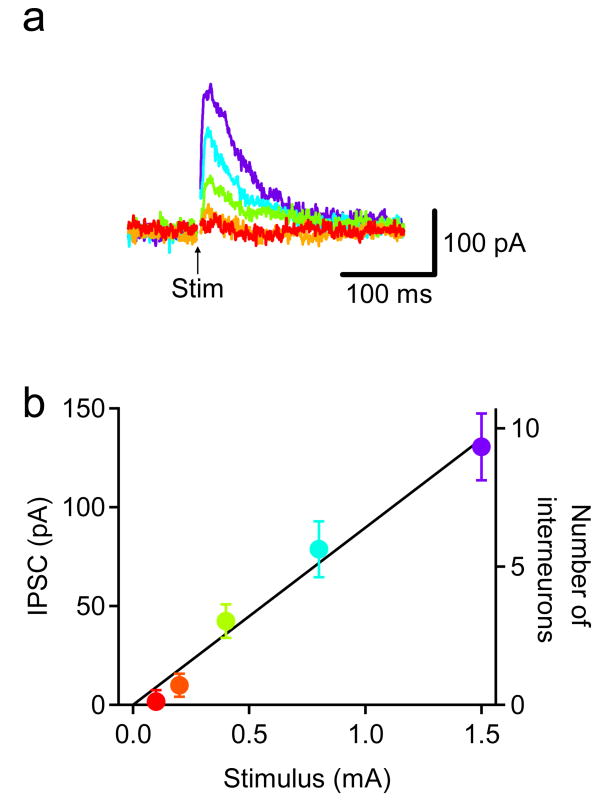
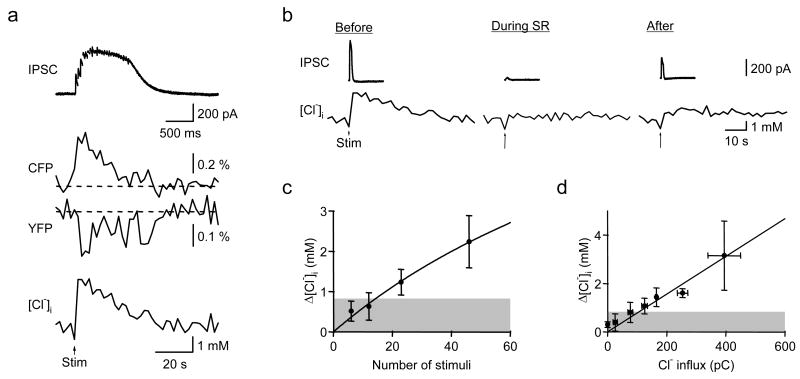
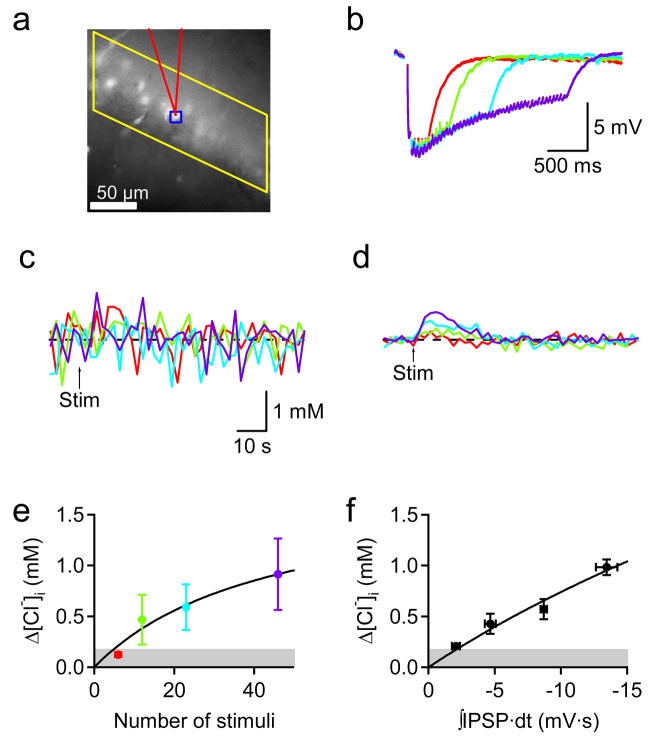
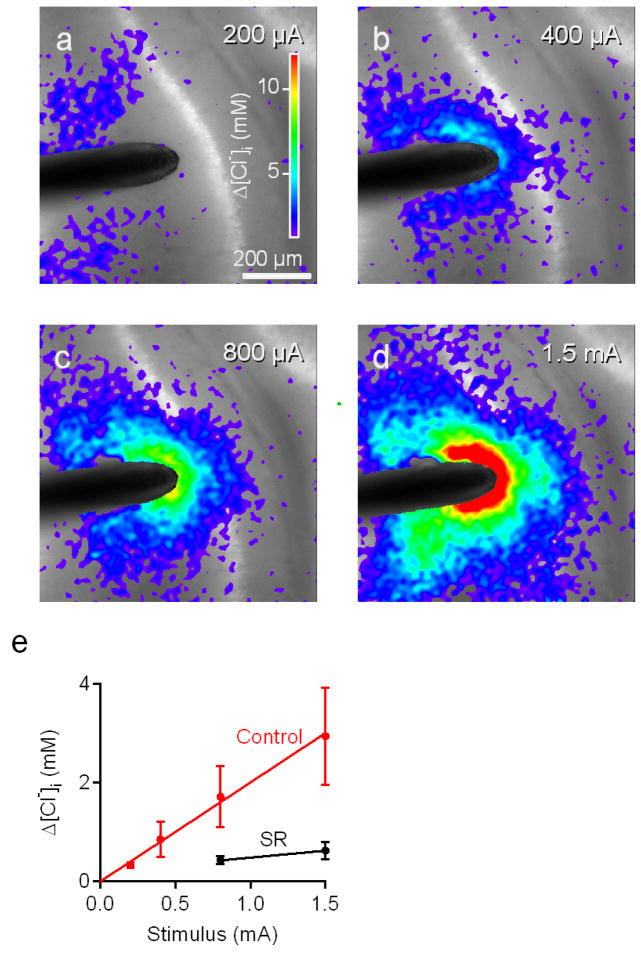
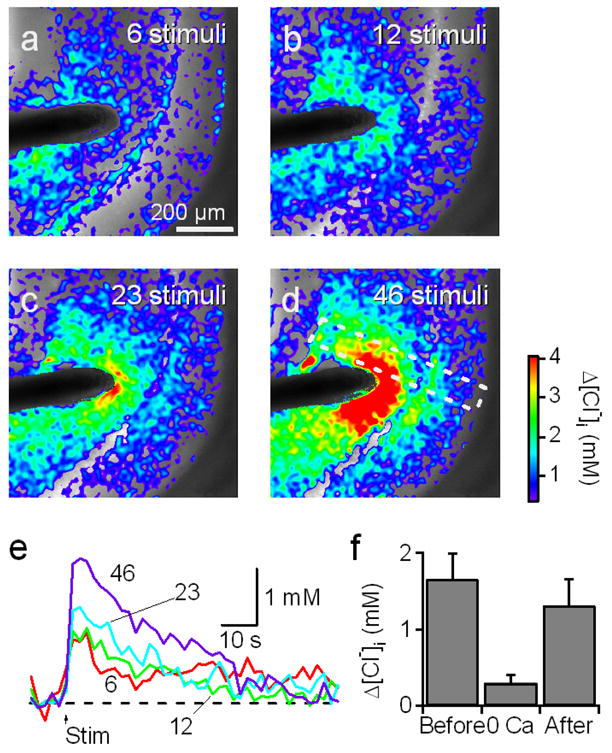
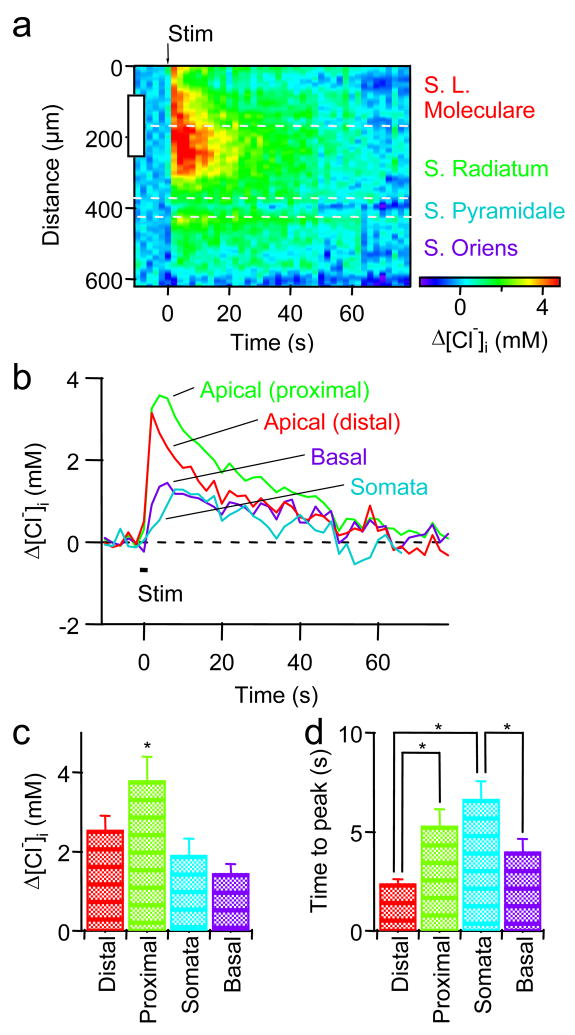
We describe here a molecular genetic approach for imaging synaptic inhibition. The thy-1 promoter was used to express high levels of Clomeleon, a ratiometric fluorescent indicator for chloride ions, in discrete populations of neurons in the brains of transgenic mice. Clomeleon was functional after chronic expression and provided non-invasive readouts of intracellular chloride concentration ([Cl(-)](i)) in brain slices, allowing us to quantify age-dependent declines in resting [Cl(-)](i) during neuronal development. Activation of hippocampal interneurons caused [Cl(-)](i) to rise transiently in individual postsynaptic pyramidal neurons. [Cl(-)](i) increased in direct proportion to the amount of inhibitory transmission, with peak changes as large as 4 mM. Integrating responses over populations of pyramidal neurons allowed sensitive detection of synaptic inhibition. Thus, Clomeleon imaging permits non-invasive, spatiotemporally resolved recordings of [Cl(-)](i) in a large variety of neurons, opening up new opportunities for imaging synaptic inhibition and other forms of chloride signaling.


Figures

Fig. 1
Fig. 1. Clomeleon expression in the brain of transgenic mice
(a) The cDNA of Clomeleon: Cyan fluorescent protein (CFP), a linker of 24 amino acid residues (grey), and the yellow fluorescent protein (YFP) Topaz. Partial schematic structure of the thy1 gene with exons labeled in roman numerals. (b) Series of sagittal brain sections of an adult CLM1 mouse. Distance from midline is indicated in each panel. YFP fluorescence was recorded with a 2x objective lens.
Fig. 2
Fig. 2. Differential expression of Clomeleon in CLM lines
(a–c) YFP fluorescence images of paramedial sagittal sections of fixed brains of adult mice from lines CLM11, 12 and 13. (d–i) Confocal images of sections taken from CLM-11, shown as maximal projections of an image stack: layer 2/3 (d) and layer 5 of two different regions (e, f) of the cortex; hilus (g), dentate gyrus (h), and CA1 neurons (i) of the hippocampus.
Fig. 3
Fig. 3. Long-term effects and functionality of Clomeleon overexpression in mice
(a) Western blot showing recombinant and in vivo expressed Clomeleon protein. Two different amounts of brain lysates were loaded. (b) Cortical layer 5 neurons recorded with two-photon laser-scanning microscope in acute slices obtained from P14 CLM11 mice. Insets show neurons from which recordings were obtained. Scale bar: 100 ms (horizontal), 50 mV (vertical).
Fig. 4
Fig. 4. Measuring resting [Cl]i in neurons
(a) Calibration in cultured hippocampal neurons via the patch pipette (open circles, n = 4–12 experiments for each concentration) and the nigericin-tributyltin method (filled circles, n = 29–46) compared with calibrations done in slices with the nigericin-tributyltin method (filled red squares, n = 24–37). Ratios were normalized to Rmax at 0 [Cl] to allow comparison of data obtained on different imaging systems. A fit of equation (1) to the average of the data points yielded Kd′ = 142 mM. Data points at 50 mM were displaced horizontally to improve visibility. (b) Spinning-disk confocal microscope imaging of YFP (left) and CFP (center) fluorescence of CA1 neurons in hippocampal slice from P21 mouse. Ratio of these fluorescence signals yielded the pseudocolor map of [Cl]i at right. (c) Somatic resting [Cl]i in hippocampal CA1 neurons (CA1), pyramidal cells of cortex (COR), principal neurons of the amygdala (AMY), and cerebellar granule cells (CGC). Values indicate mean ± SEM (n = 13–69).
Fig. 5
Fig. 5. Developmental changes in [Cl]I
(a) Pseudo-color images showing [Cl]i at different postnatal stages. Images were obtained with a confocal microscope and clipped to the same intensity range. (b) Distribution of resting [Cl]i at P5, P10 and P20. Gauss fits yielded (mean ± width) 18.6 ± 6.8 and 30.4 ± 3.7 mM at P5, 16.6 ± 5.2 at P10, 5.8 ± 5.4 at P20. (c) Summary of the data shown in b. Mean [Cl]i (open circles) could be described with a sigmoidal function (error bars indicate SEM). (d) ECl calculated from the Nernst equation (ECl = 58 mV * log([Cl]i/134 mM).
Fig. 6
Fig. 6. IPSCs to various intensity of single stimuli
(a) Representative IPSCs recorded from a CA1 pyramidal cell to single stimuli (Stim) of various intensity. The intensity of stimuli is indicated by the colors of traces that match those in b. (b) Dependence of IPSCs on the intensity of stimuli. Peak IPSCs were converted into the number of interneurons according to Maccaferri et al. (2000). Mean ± SEM of 7 experiments.
Fig. 7
Fig. 7. Simultaneous recordings of IPSCs and [Cl]i during synaptic stimulation
(a) Current (upper trace), simultaneous fluorescence (ΔF/F0, center traces) and Cl signals (bottom trace) from the soma of a CLM1 hippocampal CA1 pyramidal cell (P20). Each trace represents an average of 3 individual responses. IPSCs are shown on an expanded time scale to allow resolution of individual responses. Stimulus artifacts were blanked for clarity. The arrows (Stim) in a and b depict the time of electrical stimulation (1 s, 23 Hz) at the border of stratum radiatum and lacunosum-moleculare. Fluorescence imaging in this and all subsequent figures was done with a wide-field microscope. (b) Both IPSC and Cl transient (left) were blocked by SR (center) and partially recovered after washout (right). SR was applied at 10 μM. (c) Correlation of changes in [Cl]i and the numbers of stimuli in trains. Each point and error bar represents average and SEM, respectively, from 6 cells. A shaded region denotes RMS value of basal fluctuation in [Cl]i in single trials. (d) Correlation of changes in [Cl]i and Cl influx. 3–11 responses from 14 cells were binned.
Fig. 8
Fig. 8. Simultaneous recordings of IPSPs and [Cl]i during synaptic stimulation
(a) YFP fluorescence in hippocampal CA1 neurons of an acute brain slice obtained from a CLM1 mouse at P17. A whole-cell recording was established from the pyramidal neuron at the tip of the patch pipette (shown in red). [Cl]i was recorded from the soma of the recorded neuron (indicated by blue square) and surrounding pyramidal neurons (area indicated by yellow parallelogram). (b) Somatic membrane potential recording from the cell shown in a. Responses produced by four different trains of stimuli are indicated by the same color in panels a to e (see e for the number of stimuli in each train). Traces represent average of 4 trials. (c) Somatic [Cl]i recording of the cell shown in a and b; trace represents average of 4 trials. Arrow (Stim) indicates time of electrical stimulation. (d) Recording of average changes in [Cl]i recorded from the yellow area shown in a. Arrow (Stim) indicates time of electrical stimulation and traces represent average of 4 trials. The calibration bar in c also applies to d. (e) Correlation between changes in average [Cl]i and the number of stimuli. Each point and error bar represents average and SEM, respectively, from 4 slices. Shaded region denotes RMS value of basal fluctuations in [Cl]i recorded from the stratum pyramidale without averaging over trials. (f) Correlation between changes in [Cl]i and time integrals of IPSPs. 2–16 responses from 4 cells were binned.
Fig. 9
Fig. 9. Cl responses to varying stimulus intensity
(a–d) Images showing Cl changes (pseudo-color scale) superimposed on YFP fluorescence image (grey scale) measured in CLM1 hippocampal slice (P21). Electrical stimulation was delivered for 1 s with a current of 200 μA (a), 400 μA (b), 800 μA (c), or 1.5 mA (d). Images were acquired 4 s after each stimulus. (e) Dependence of [Cl]i changes, measured from whole CA1 field, on the intensity of stimuli before (Control) and during application of 10-μM SR (SR). The response was fitted with a linear regression that went through the origin with a slope of 2.0 mM/mA. Mean ± SEM of 4 experiments.
Fig. 10
Fig. 10. Cl transients elicited by synaptic stimulation in unperturbed neurons
(a–d) Images showing Cl changes (pseudo-color) superimposed on YFP fluorescence (grey scale) measured in CLM1 hippocampal slice (P16). The slice was oriented so that the stratum lacunosum-moleculare/radiatum (apical dendrites) to the left, the stratum pyramidale (somata) at center, and the stratum oriens (basal dendrites) to the right. A train of brief electrical stimuli (800 μA; 23 Hz) was delivered by the electrode (black) for 250 ms (6 stimuli, a), for 500 ms (12 stimuli, b), for 1 s (23 stimuli, c) and 2 s (46 stimuli, d). Cl was imaged every 2 s and repeated 4 times for each duration for averaging. The region within the white dotted rectangle was used for further analysis in Fig. 11. (e) Changes in [Cl]i averaged over the whole CA1 in the field shown in a-d. The arrow (Stim) depicts the onset of electrical stimulation. (f) Reversible decrease of Cl response in nominally Ca2+-free solution. The duration of the train was 1 s (23 stimuli). Mean ± SEM of 6 experiments.
Fig. 11
Fig. 11. Spatiotemporal profiles of Cl transients
(a) A line-scan of [Cl]i changes across the layers of CA1. The area of analysis is indicated by the white dotted rectangle in Fig. 10d and resting [Cl]i before stimuli was subtracted to show relative changes caused by stimulation (at arrow). A white rectangle on the ordinate denotes the size and the position of the stimulating electrode. (b) Changes in [Cl]i calculated from each layer. Trace colors correspond to those of labels in a. Duration of 2 s stimulus train is depicted as a line (Stim). (c) Peak magnitude of [Cl]i changes in the four compartments of pyramidal cells in each layer. Mean ± SEM of 7 experiments. * denotes a significant difference from the rest by ANOVA followed by Newman-Keuls test (*p < 0.05). (d) Time to peak of [Cl]i changes in the same four compartments of pyramidal cells. * denotes a significant difference, as determined by ANOVA followed by Newman-Keuls test (*p < 0.05).

References

    1. Agmon A, Connors BW. Correlation between intrinsic firing patterns and thalamocortical synaptic responses of neurons in mouse barrel cortex. J Neurosci. 1992;12:319–329. - PMC - PubMed
    1. Alger BE, Nicoll RA. GABA-mediated biphasic inhibitory responses in hippocampus. Nature. 1979;281:315–317. - PubMed
    1. Andersen P, Dingledine R, Gjerstad L, Langmoen IA, Laursen AM. Two different responses of hippocampal pyramidal cells to application of gamma-amino butyric acid. J Physiol (Lond) 1980;305:279–296. - PMC - PubMed
    1. Baker BJ, Kosmidis EK, Vucinic D, Falk CX, Cohen LB, Djurisic M, Zecevic D. Imaging brain activity with voltage- and calcium-sensitive dyes. Cell Mol Neurobiol. 2005;25:245–282. - PMC - PubMed
    1. Barker JL, Ransom BR. Amino acid pharmacology of mammalian central neurones grown in tissue culture. J Physiol (Lond) 1978;280:331–354. - PMC - PubMed

Publication types

MeSH terms

LinkOut - more resources