. 2008 Apr;19(4):392-8.
doi: 10.1111/j.1467-9280.2008.02098.x.

The representation of simple ensemble visual features outside the focus of attention

Affiliations

The representation of simple ensemble visual features outside the focus of attention

George A Alvarez et al. Psychol Sci. 2008 Apr.

Abstract

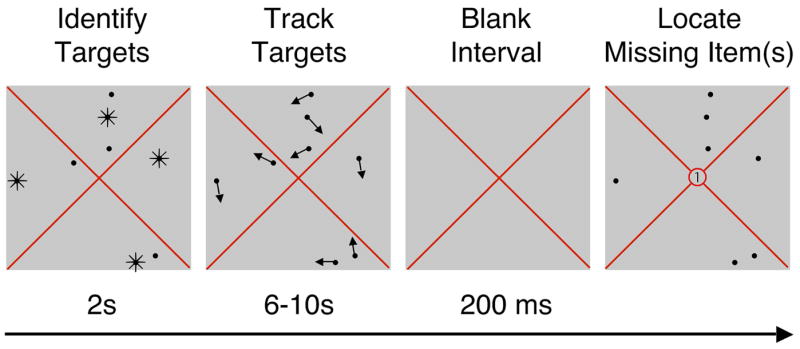
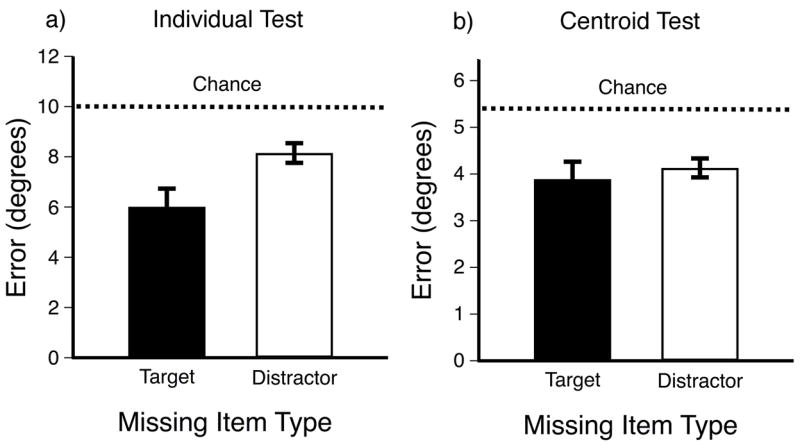
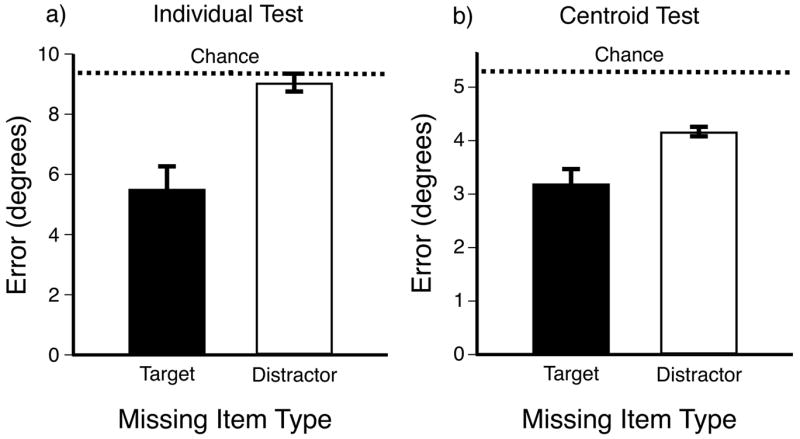
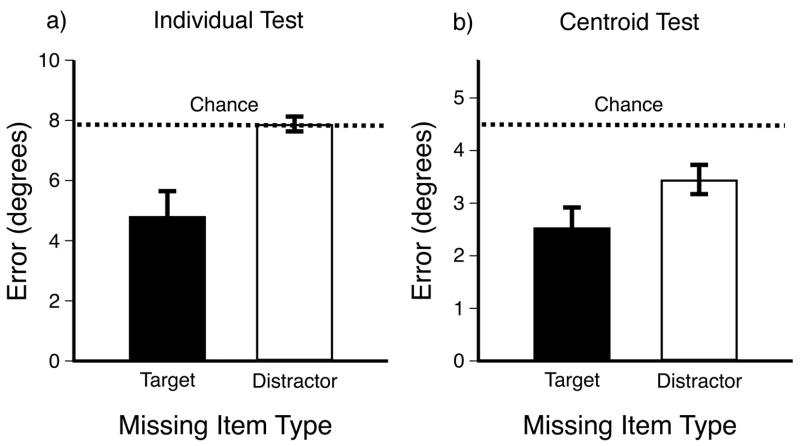
The representation of visual information inside the focus of attention is more precise than the representation of information outside the focus of attention. We found that the visual system can compensate for the cost of withdrawing attention by pooling noisy local features and computing summary statistics. The location of an individual object is a local feature, whereas the center of mass of several objects (centroid) is a summary feature representing the mean object location. Three experiments showed that withdrawing attention degraded the representation of individual positions more than the representation of the centroid. It appears that information outside the focus of attention can be represented at an abstract level that lacks local detail, but nevertheless carries a precise statistical summary of the scene. The term ensemble features refers to a broad class of statistical summary features that we propose collectively make up the representation of information outside the focus of attention.


Figures

Figure 1
Figure 1
Multiple object tracking plus missing item localization. At the beginning of each trial 4 items blinked off and on to identify them as targets. Then all items moved about the display and participants counted the total number of times a target circle touched a red line. At an unpredictable time between 6 and 10s from the onset of motion, there was a brief 200ms blank interval, followed by a final test display consisting of stationary items. Either 1 item was missing (a random target or distractor) or 4 items were missing (all of the targets or all of the distractors). A single digit at the center of the display informed participants of how many items were missing. The task was to indicate where the missing items were located, clicking directly on the location of a single missing item, or on the “centroid” of 4 missing items.
Figure 2
Figure 2
Results of Experiment 1. Error in degrees for localizing missing items. Error bars represent 1 s.e.m. a) Error in localizing individual targets and distractors. Performance was better for targets than distractors, and was better than chance for both targets and distractors. b) Error in localizing the centroid of targets and distractors. Performance was not significantly different for targets and distractors, and was better than chance for both targets and distractors.
Figure 3
Figure 3
Results of Experiment 2. Error in degrees for localizing missing items. Error bars represent 1 s.e.m. a) Error in localizing individual targets and distractors. Performance was better for targets than distractors, and was better than chance for targets, but not for distractors. b) Error in localizing the centroid of targets and distractors. Performance was significantly better for targets than distractors, and was better than chance for both targets and distractors.
Figure 4
Figure 4
Results of Experiment 3. Error in degrees for localizing missing items. Error bars represent 1 s.e.m. a) Error in localizing individual targets and distractors. Performance was better for targets than distractors, and was better than chance for targets, but not for distractors. b) Error in localizing the centroid of targets and distractors. Performance was significantly better for targets than distractors, and was better than chance for both targets and distractors.

References

    1. Ariely D. Seeing sets: representation by statistical properties. Psychol Sci. 2001;12(2):157–62. - PubMed
    1. Brainard DH. The psychophysics toolbox. Spat Vis. 1997;10(4):433–6. - PubMed
    1. Cavanagh P, Alvarez GA. Tracking multiple targets with multifocal attention. Trends Cogn Sci. 2005;9(7):349–54. - PubMed
    1. Chong SC, Treisman A. Representation of statistical properties. Vision Res. 2003;43(4):393–404. - PubMed
    1. Chong SC, Treisman A. Attentional spread in the statistical processing of visual displays. Percept Psychophys. 2005a;67(1):1–13. - PubMed

Publication types

LinkOut - more resources