

Structural probing of the HIV-1 polypurine tract RNA:DNA hybrid using classic nucleic acid ligands
- PMID: 18400780
- PMCID: PMC2377446
- DOI: 10.1093/nar/gkn129
Structural probing of the HIV-1 polypurine tract RNA:DNA hybrid using classic nucleic acid ligands
Abstract
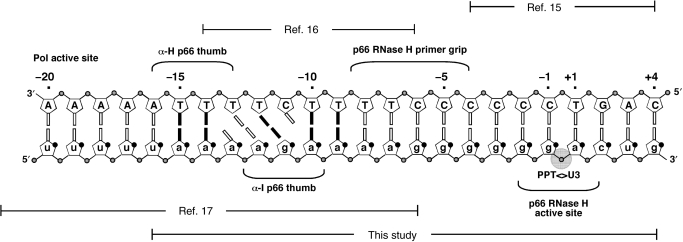
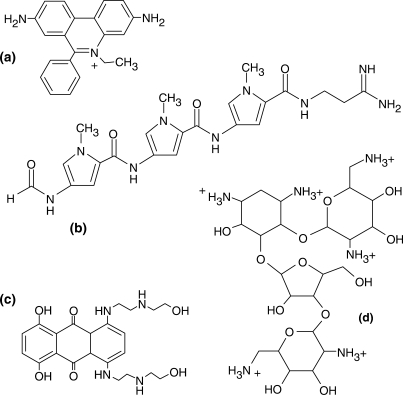
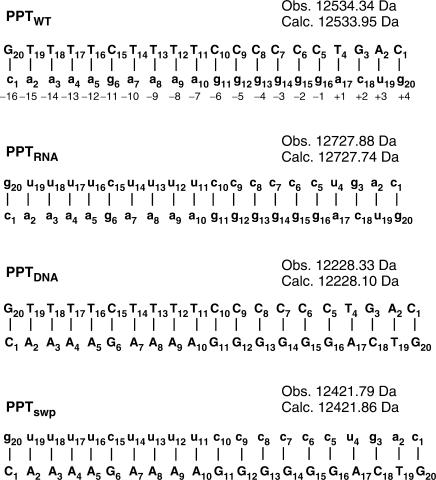
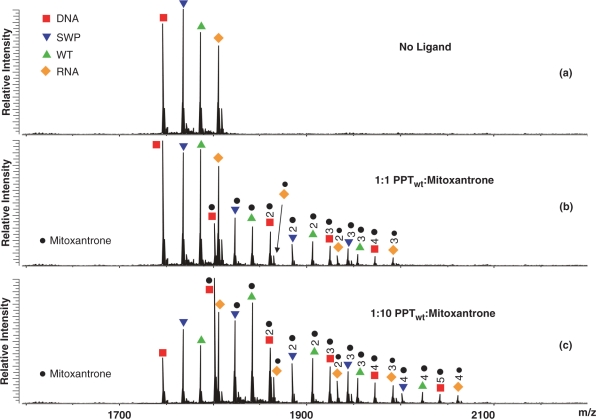
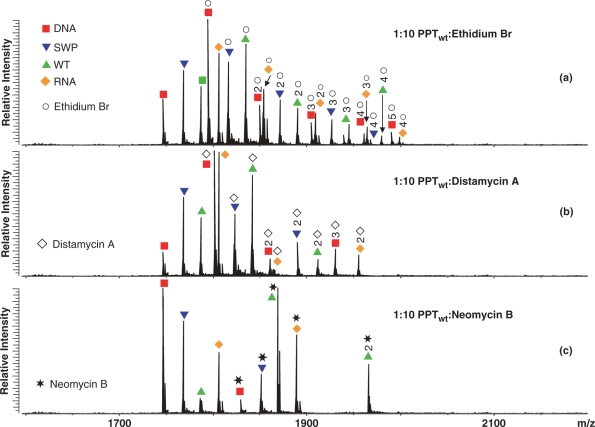
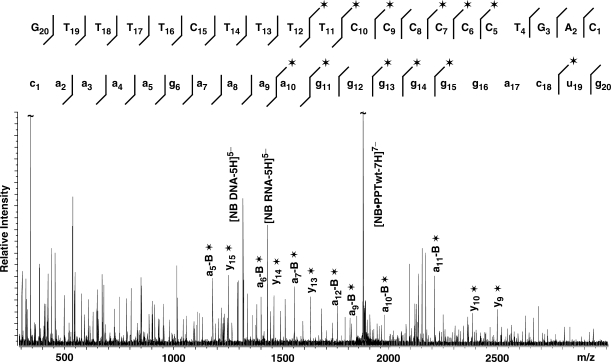
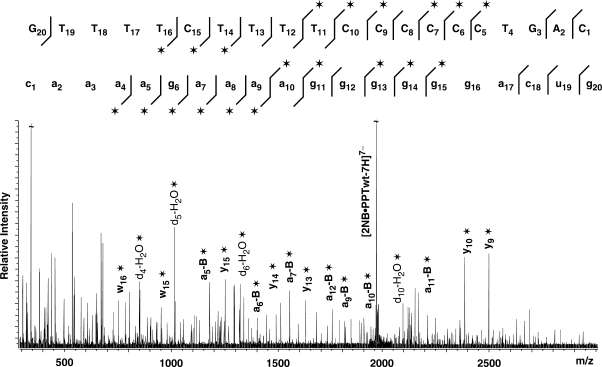
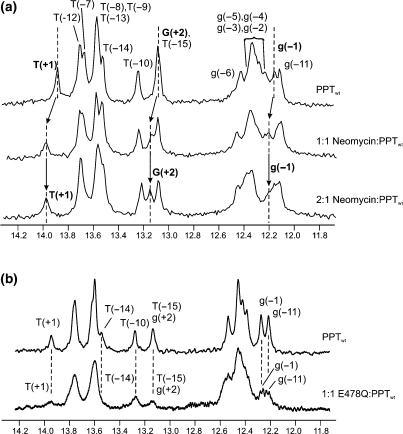
The interactions of archetypical nucleic acid ligands with the HIV-1 polypurine tract (PPT) RNA:DNA hybrid, as well as analogous DNA:DNA, RNA:RNA and swapped hybrid substrates, were used to probe structural features of the PPT that contribute to its specific recognition and processing by reverse transcriptase (RT). Results from intercalative and groove-binding ligands indicate that the wild-type PPT hybrid does not contain any strikingly unique groove geometries and/or stacking arrangements that might contribute to the specificity of its interaction with RT. In contrast, neomycin bound preferentially and selectively to the PPT near the 5'(rA)(4):(dT)(4) tract and the 3' PPT-U3 junction. Nuclear magnetic resonance data from a complex between HIV-1 RT and the PPT indicate RT contacts within the same regions highlighted on the PPT by neomycin. These observations, together with the fact that the sites are correctly spaced to allow interaction with residues in the ribonuclease H (RNase H) active site and thumb subdomain of the p66 RT subunit, suggest that despite the long cleft employed by RT to make contact with nucleic acids substrates, these sites provide discrete binding units working in concert to determine not only specific PPT recognition, but also its orientation on the hybrid structure.
Figures
Similar articles
-
Probing anomalous structural features in polypurine tract-containing RNA-DNA hybrids with neomycin B.Biochemistry. 2009 Jul 28;48(29):6988-97. doi: 10.1021/bi900357j. Biochemistry. 2009. PMID: 19449839 Free PMC article.
-
Two modes of HIV-1 polypurine tract cleavage are affected by introducing locked nucleic acid analogs into the (-) DNA template.J Biol Chem. 2004 Aug 27;279(35):37095-102. doi: 10.1074/jbc.M403306200. Epub 2004 Jun 25. J Biol Chem. 2004. PMID: 15220330
-
Using pyrrolo-deoxycytosine to probe RNA/DNA hybrids containing the human immunodeficiency virus type-1 3' polypurine tract.Nucleic Acids Res. 2004 Mar 5;32(4):1539-47. doi: 10.1093/nar/gkh307. Print 2004. Nucleic Acids Res. 2004. PMID: 15004241 Free PMC article.
-
'Binding, bending and bonding': polypurine tract-primed initiation of plus-strand DNA synthesis in human immunodeficiency virus.Int J Biochem Cell Biol. 2004 Sep;36(9):1752-66. doi: 10.1016/j.biocel.2004.02.016. Int J Biochem Cell Biol. 2004. PMID: 15183342 Review.
-
Exploiting structurally diverse nucleoside analogs as probes of reverse transcription complexes.Curr HIV Res. 2007 Jan;5(1):11-22. doi: 10.2174/157016207779316332. Curr HIV Res. 2007. PMID: 17266554 Review.
Cited by
-
Fidelity of plus-strand priming requires the nucleic acid chaperone activity of HIV-1 nucleocapsid protein.Nucleic Acids Res. 2009 Apr;37(6):1755-66. doi: 10.1093/nar/gkn1045. Epub 2009 Jan 21. Nucleic Acids Res. 2009. PMID: 19158189 Free PMC article.
-
Functional recognition of the modified human tRNALys3(UUU) anticodon domain by HIV's nucleocapsid protein and a peptide mimic.J Mol Biol. 2011 Jul 22;410(4):698-715. doi: 10.1016/j.jmb.2011.04.025. J Mol Biol. 2011. PMID: 21762809 Free PMC article.
-
Probing anomalous structural features in polypurine tract-containing RNA-DNA hybrids with neomycin B.Biochemistry. 2009 Jul 28;48(29):6988-97. doi: 10.1021/bi900357j. Biochemistry. 2009. PMID: 19449839 Free PMC article.
-
Higher-order structure of nucleic acids in the gas phase: top-down analysis of base-pairing interactions.Int J Mass Spectrom. 2012 Feb 15;312:155-162. doi: 10.1016/j.ijms.2011.07.014. Int J Mass Spectrom. 2012. PMID: 24027423 Free PMC article.
-
The essential role of stacking adenines in a two-base-pair RNA kissing complex.J Am Chem Soc. 2013 Apr 17;135(15):5602-11. doi: 10.1021/ja310820h. Epub 2013 Apr 8. J Am Chem Soc. 2013. PMID: 23517345 Free PMC article.
References
-
- Champoux JJ. Roles of ribonuclease H in reverse transcription. In: Skalka AM, Goff SP, editors. Reverse transcriptase. Cold Spring Harbor, NY: Cold Spring Harbor Laboratory Press; 1993. pp. 103–117.
-
- Telesnitsky A, Goff SP. Reverse transcriptase and the generation of retroviral DNA. In: Coffin JM, Hughes SH, Varmus HE, editors. Retroviruses. Cold Spring Harbor, NY: Cold Spring Harbor Laboratory Press; 1997. pp. 121–160. - PubMed
-
- Rausch JW, Le Grice SF. ‘Binding, bending and bonding’: polypurine tract-primed initiation of plus-strand DNA synthesis in human immunodeficiency virus. Int. J. Biochem. Cell Biol. 2004;36:1752–1766. - PubMed
-
- Pillay D, Taylor S, Richman DD. Incidence and impact of resistance against approved antiretroviral drugs. Rev. Med. Virol. 2000;10:231–253. - PubMed
-
- Johnson VA, Brun-Vezinet F, Clotet B, Kuritzkes DR, Pillay D, Schapiro JM, Richman DD. Update of the drug resistance mutations in HIV-1: Fall 2006. Top HIV Med. 2006;14:125–130. - PubMed
