. 2008 Apr 9;28(15):3966-75.
doi: 10.1523/JNEUROSCI.5625-07.2008.

The distinct temporal origins of olfactory bulb interneuron subtypes

Affiliations

The distinct temporal origins of olfactory bulb interneuron subtypes

Renata Batista-Brito et al. J Neurosci. .

Abstract

Olfactory bulb (OB) interneurons are a heterogeneous population produced beginning in embryogenesis and continuing through adulthood. Understanding how this diversity arises will provide insight into how OB microcircuitry is established as well as adult neurogenesis. Particular spatial domains have been shown to contribute specific interneuron subtypes. However, the temporal profile by which OB interneuron subtypes are produced is unknown. Using inducible genetic fate mapping of Dlx1/2 precursors, we analyzed the production of seven OB interneuron subtypes and found that the generation of each subpopulation has a unique temporal signature. Within the glomerular layer, the production of tyrosine hydroxylase-positive interneurons is maximal during early embryogenesis and decreases thereafter. In contrast, the generation of calbindin interneurons is maximal during late embryogenesis and declines postnatally, whereas calretinin (CR) cell production is low during embryogenesis and increases postnatally. Parvalbumin interneurons within the external plexiform layer are produced only perinatally, whereas the generation of 5T4-positive granule cells in the mitral cell layer does not change significantly over time. CR-positive granule cells are not produced at early embryonic time points, but constitute a large percentage of the granule cells born after birth. Blanes cells in contrast are produced in greatest number during embryogenesis. Together we provide the first comprehensive analysis of the temporal generation of OB interneuron subtypes and demonstrate that the timing by which these populations are produced is tightly orchestrated.


Figures

Figure 1.
Figure 1.
Fate-mapping strategy of OB interneuron progenitors. Mice expressing tamoxifen-inducible CreER under the control Dlx1/2 intragenic enhancer region, crossed with the RosaYFP reporter line, which express YFP after LoxP recombination. Tamoxifen was administered at the indicated time points, and the OBs were analyzed at P30 and P60.
Figure 2.
Figure 2.
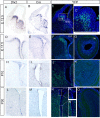
Short-term fate-mapping analysis. Dlx1/2-CreER RosaYFP animals were given tamoxifen (tx) at various time points and killed 24 h later to compare Dlx2 expression (A, D, H, L) with Cre expression (B, E, I, M) and YFP expression/recombination in the LGE (C, C′), SVZ (F, J, N, N′, N″), and the olfactory bulb (G, K, O). A–C, E12.5 tx administration, E13.5 analysis. D–G, E17.5 tx administration, E18.5 analysis. H–K, P10 tx administration, P11 analysis. L–O, P30 tx administration, P31 analysis. N′, Dorsal SVZ YFP expression. N″, Ventral SVZ YFP expression.
Figure 3.
Figure 3.
Olfactory bulb interneuron diversity. We could distinguish seven OB interneuron populations based on their position and expression of immunomarkers. A, Example section of mouse olfactory bulb. B, TH-expressing GL cell (blue). C, CB-expressing GL cell (green). D, CR-expressing GL cell (red). E, PV-expressing EPL cell (orange). F, 5T4-expressing MCL granule cell (purple). G, CR-expressing GCL granule cell (red). H, CB-positive Blanes cell in GCL (green).
Figure 4.
Figure 4.
Dlx1/2-CreER RosaYFP temporal fate mapping. A, The percentage of YFP+ cells residing in each layer of OB from animals fate mapped at E12.5 (yellow), E15.5 (light orange), E17.5 (dark orange), P0 (dark green), P5 (green), P10 (lime green), and P30 (light green). B, The number of YFP+ cells/mm2 of olfactory bulb. E12.5, 3.54 ± 0.3 YFP+ cells/mm2; n = 4 animals. E15.5, 22.4 ± 3.5 YFP+ cells/mm2; n = 4 animals. E17.5, 100 ± 12 cells/mm2; n = 4 animals. P0, 294 ± 76 cells/mm2; n = 3 animals. P5, 350 ± 48 cells/mm2; n = 3 animals. P10, 248 ± 26 cells/mm2; n = 4 animals. P30, 22 ± 6 cells/mm2; n = 3 animals. C, Example section from E15.5 tamoxifen administration, P30 analysis, immunostained for YFP (green) and stained with DAPI (blue) nuclear stain. D, P0 tamoxifen administration, P30 analysis. E, P30 tamoxifen administration, P60 analysis. Error bars represent SEM. **p < 0.0001, ANOVA.
Figure 5.
Figure 5.
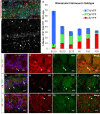
Temporal fate mapping of GL interneurons. A, Boxed colored micrograph with red bar to left indicates that this analysis is confined to the GL. B, A percentage comparison of the relative production of TH, CB, and CR interneuron subtypes produced at different time points during development. At E12.5, TH-positive cells (blue bars) make up the largest percentage (60.7 ± 8), followed by CB (green bars; 5.6 ± 4) and CR (red bars; 2.5 ± 2); at E15.5, CB-positive cells make up the highest percentage at 16.6 ± 1, followed by TH (14.5 ± 2) and CR (10.1 ± 2); at E17.5, CB-positive cells make up the highest percentage at 16.1 ± 1, followed by TH (8.2 ± 2) and CR (7.3 ± 1); at P0, all three subtypes are produced in similar proportions: TH, 12.6 ± 1; CB, 11.2 ± 1; and CR, 12.7 ± 1; at P10, CR-positive cells make up the majority of GL cells at 18.5 ± 2, followed by TH (9.9 ± 1) and CB (8.9 ± 1); finally, at P30, CR-positive cells make up 26.8 ± 3% of GL YFP+ cells, followed by TH (3.9 ± 2) and CB (2.4 ± 1). Error bars indicate SEM. *p < 0.005, ANOVA; **p < 0.0001, ANOVA. C, Example 20× section from E12.5 fate-mapped OB GL, showing TH (red), YFP (green), and DAPI (blue); arrow indicates double-labeled cell. D–F, Example 40× section from E12.5 fate-mapped OB GL; shown are TH (D, red), YFP (E, green), and merge (F); arrows indicate TH/YFP double-positive cell. G, Example 20× section from E17.5 fate-mapped OB GL; shown are CB (red), YFP (green), and DAPI (blue); arrows indicate double-labeled cells. H–J, Example 40× section from E17.5 fate-mapped OB GL; shown are CB (H, red), YFP (I, green), and merged image (J); arrows indicate CB/YFP double-labeled cell. K, Example 20× section from P0 fate-mapped OB GL; shown are CR (red), YFP (green), and DAPI (blue); arrow indicates double-labeled cell. L–N, Example 40× section from P0 fate-mapped OB GL; shown are CR (L, red), YFP (M, green), and merged image (N); arrows indicate CR/YFP double-labeled cell.
Figure 6.
Figure 6.
Production of PV cells of the EPL over time. A, Boxed colored micrograph with red bar to left indicates that this analysis is confined to the EPL. B, Quantification of percentage of EPL YFP+ cells expressing PV from each fate-mapped time point. Of cells from E12.5 and P30 animals in EPL, 0% were PV+; at E15.5, 12.5 ± 6% of EPL YFP+ cells expressed PV; at E17.5, 27.4 ± 4% expressed PV; at P0, 26.8 ± 5% expressed PV; and at P10, 29.9 ± 4% were PV positive. **p < 0.001, ANOVA. C, Example 20× section of EPL from P10 fate-mapped animal showing PV (red), YFP (green), and DAPI (blue). Arrow indicates double-positive cell. D–F, Example 40× section from P10 fate-mapped OB; shown are PV (D, red), YFP (E, green), and merge (F); arrows indicate double-labeled cells.
Figure 7.
Figure 7.
Temporal fate mapping of granule cell subtypes. A, Boxed colored micrograph with red bar to left indicates that this analysis is confined to the MCL and GCL. B, Quantification of the percentage of YFP+ cells in the MCL expressing 5T4: E12.5, 44.4 ± 13.7%; E15.5, 37.8 ± 14.2%; E17.5, 48.4 ± 7.2%; P0, 23.6 ± 1%; P10, 21.1 ± 2%; P30, 17.8 ± 6%. C, Quantification of the percentage of YFP+ cells in the GCL expressing CR: E12.5, 0%; E15.5, 5 ± 1%; E17.5, 4.8 ± 1%; P0, 12.8 ± 1%; P10, 6.8 ± 1%; P30, 8.0 ± 1%. D, Example 20× MCL section from E17.5 fate-mapped OB with 5T4 (red), YFP (green), and DAPI (blue) staining. E–G, Example 40× section from E17.5 fate-mapped MCL granule cells expressing 5T4 (E, red), YFP (F, green), and merge (G); arrows indicate double-labeled cells. H, Example 20× GCL section from P0 fate-mapped OB with CR (red), YFP (green), and DAPI (blue) staining. H–K, Example 40× section from P0 fate-mapped GCL cells expressing CR (H, red), YFP (J, green), and merge (K); arrows indicate double-labeled cell. **p < 0.001, ANOVA.
Figure 8.
Figure 8.
Blanes cell fate mapping. A, Boxed colored micrograph with red bar to left indicates that this analysis is confined to the GCL. B, Quantification of Blanes cell production as a percentage of YFP+ cells in the GCL: E12.5, 1.4 ± 0.5%; E15.5, 1.6 ± 0.5%; E17.5, 0.6 ± 0.1%; P0, 0.5 ± 0.1%; P10, 0.1 ± 0.02%; P30, 0.2 ± 0.1%. C–E, Example 20× GCL section from an E17.5 fate-mapped animal (C, merge) showing a CB-positive (D, red) Blanes cell, double positive for YFP (E, green); arrows indicate double-positive cell. F, Example 40× section from P0 fate-mapped animal showing YFP-positive (green) Blanes cell in the GCL. *p < 0.05, ANOVA.
Figure 9.
Figure 9.
Summary of temporal patterns of OB interneuron production. A, TH+ GL cells make up the highest percentage of YFP+ cells during early embryogenesis and decline with the age of the animal as a percentage of GL cells produced. B, CB+ cells make up the highest percentage of YFP+ GL cells during late embryogenesis and decline thereafter. C, CR+ GL cells make up a very small percentage of YFP+ cells during embryogenesis, but increase with the age of the animal fate mapped. D, PV+ cells are not produced at E12.5 or P30, but make up a substantial proportion of EPL YFP+ cells fate mapped from late embryogenesis and early postnatal ages. E, 5T4-positive granule cell production does not change significantly with the age of the fate-mapped animal. F, CR-positive granule cell production reaches a peak as a percentage of YFP+ GCL cells just after birth. G, Blanes cells make up the highest percentage of GCL cells during embryonic ages. H, Interneurons of the OB: TH (blue), CB (green), CR (red), PV (orange), and 5T4 (purple).

Comment in

References

    1. Alvarez-Buylla A, Garcia-Verdugo JM. Neurogenesis in adult subventricular zone. J Neurosci. 2002;22:629–634. - PMC - PubMed
    1. Anderson SA, Qiu M, Bulfone A, Eisenstat DD, Meneses J, Pedersen R, Rubenstein JL. Mutations of the homeobox genes Dlx-1 and Dlx-2 disrupt the striatal subventricular zone and differentiation of late born striatal neurons. Neuron. 1997;19:27–37. - PubMed
    1. Aungst JL, Heyward PM, Puche AC, Karnup SV, Hayar A, Szabo G, Shipley MT. Centre-surround inhibition among olfactory bulb glomeruli. Nature. 2003;426:623–629. - PubMed
    1. Bayer SA. 3H-thymidine-radiographic studies of neurogenesis in the rat olfactory bulb. Exp Brain Res. 1983;50:329–340. - PubMed
    1. Betarbet R, Zigova T, Bakay RA, Luskin MB. Dopaminergic and GABAergic interneurons of the olfactory bulb are derived from the neonatal subventricular zone. Int J Dev Neurosci. 1996;14:921–930. - PubMed

Publication types

MeSH terms