Comparative Study
. 2008 Apr 10:9:36.
doi: 10.1186/1471-2202-9-36.

Protein fingerprints of cultured CA3-CA1 hippocampal neurons: comparative analysis of the distribution of synaptosomal and cytosolic proteins

Affiliations
Comparative Study

Protein fingerprints of cultured CA3-CA1 hippocampal neurons: comparative analysis of the distribution of synaptosomal and cytosolic proteins

Valeria Corti et al. BMC Neurosci. .

Abstract

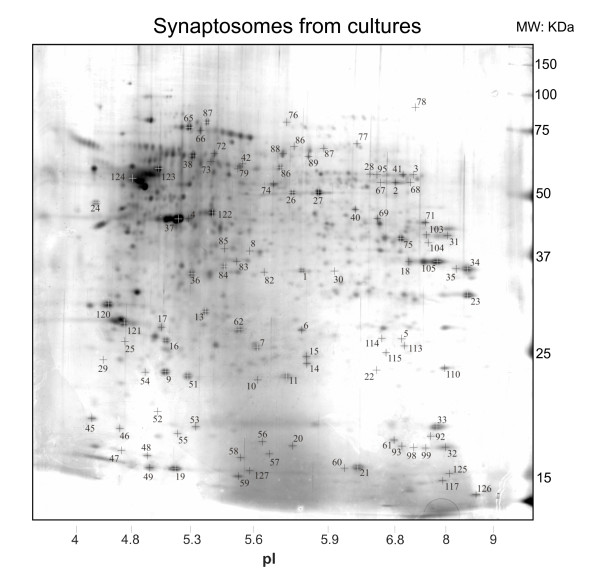
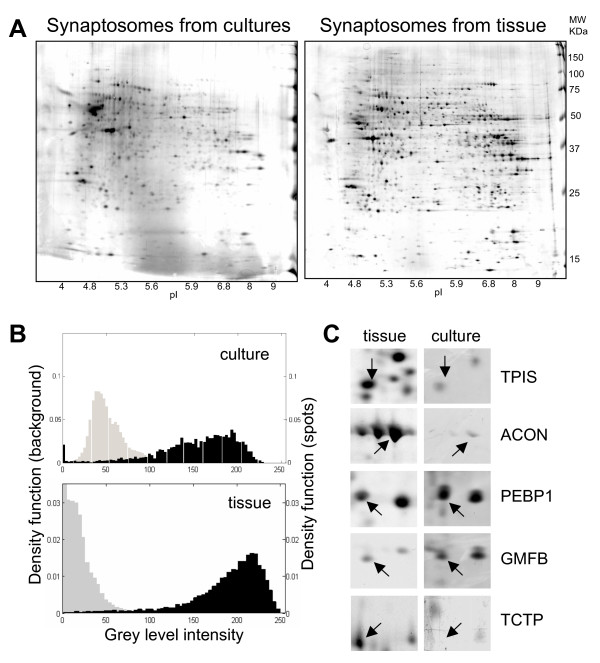
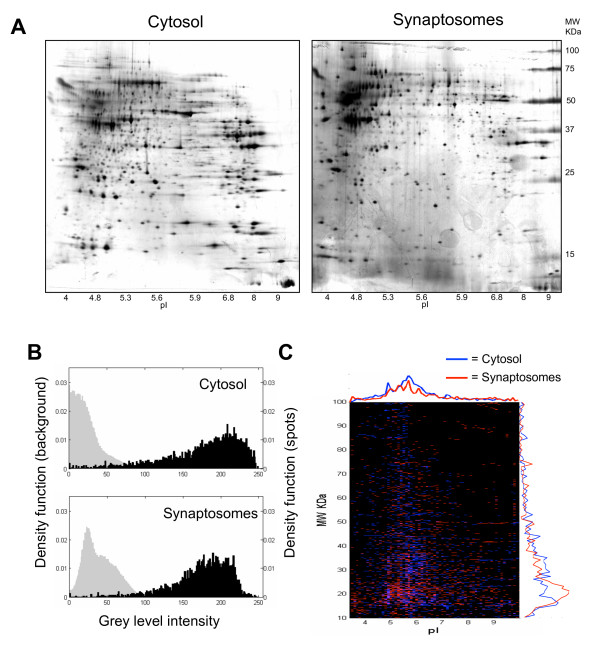
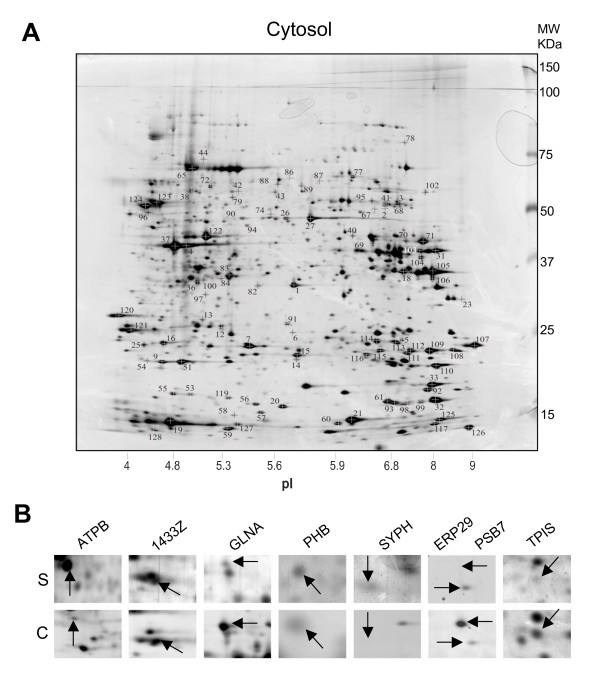
Background: All studies aimed at understanding complex molecular changes occurring at synapses face the problem of how a complete view of the synaptic proteome and of its changes can be efficiently met. This is highly desirable when synaptic plasticity processes are analyzed since the structure and the biochemistry of neurons and synapses get completely reshaped. Because most molecular studies of synapses are nowadays mainly or at least in part based on protein extracts from neuronal cultures, this is not a feasible option: these simplified versions of the brain tissue on one hand provide an homogeneous pure population of neurons but on the other yield only tiny amounts of proteins, many orders of magnitude smaller than conventional brain tissue. As a way to overcome this limitation and to find a simple way to screen for protein changes at cultured synapses, we have produced and characterized two dimensional electrophoresis (2DE) maps of the synaptic proteome of CA3-CA1 hippocampal neurons in culture.

Results: To obtain 2D maps, hippocampal cultures were mass produced and after synaptic maturation, proteins were extracted following subfractionation procedures and separated by 2D gel electrophoresis. Similar maps were obtained for the crude cytosol of cultured neurons and for synaptosomes purified from CA3-CA1 hippocampal tissue. To efficiently compare these different maps some clearly identifiable reference points were molecularly identified by mass spectrometry and immunolabeling methods. This information was used to run a differential analysis and establish homologies and dissimilarities in these 2D protein profiles.

Conclusion: Because reproducible fingerprints of cultured synapses were clearly obtained, we believe that our mapping effort could represent a simple tool to screen for protein expression and/or protein localization changes in CA3-CA1 hippocampal neurons following plasticity.


Figures

Figure 1
Figure 1
Silver stained two-dimensional gel electrophoresis reference map of synaptosomes from CA3-CA1 neuronal cultures. The numbered spots were chosen for further characterization by tryptic digestion and MALDI MS. Among these: 3, synapsin II; 29, synaptophysin; 30, sintaxin 1A; 45, β-synuclein; 56, α-synuclein (for complete list see table 1).
Figure 2
Figure 2
Comparative analysis of protein profiles from synaptosomes obtained from CA3-CA1 cultured cells and CA3-CA1 hippocampal brain tissue. A) Exemplar protein profiles of the synaptosomes from CA3-CA1 cultures (left), and CA3-CA1 hippocampal tissue (right), separated by two-dimensional gel electrophoresis and silver stained. B) Distribution of spot intensities (black histograms) and background noise (grey histograms) from the same 2D gels in panel A from cultures (upper panel) and hippocampal tissue (lower panel). C) Some exemplar proteins whose expression differed between the two samples. TPIS: Triosophosphate isomerase; ACOM: mitochondrial aconitase; PEBP1: Phosphatydilethanolamine-binding protein 1; GMFB: Glial maturation factor beta; TCTP: translationally controlled tumor protein (see also table 1).
Figure 3
Figure 3
Comparative analysis of protein profiles from synaptosomes and crude cytosolic fractions obtained from CA3-CA1 cultured cells. A) Exemplar protein profiles of crude cytosolic (left) and synaptosomes (right) fractions, separated by two-dimensional gel electrophoresis and silver stained. B) Distributions of spot intensities (black histograms) and background noise (grey histograms) from the same 2D gels of panel A from cytosol (upper panel) and synaptosomes (lower panel). C) Digital representation of the superimposition of the two protein profiles (cytosol, blue; synaptosomes, red) after spot detection (see methods for details).
Figure 4
Figure 4
Silver stained two-dimensional gel electrophoresis reference map of the crude cytosolic fraction from CA3-CA1 neuronal cultures and comparison with profiles from synaptosomes. A) 2D reference map from crude cytosolic fraction stained using silver. The numbered spots were chosen for further characterization by tryptic digestion and MALDI MS. C) Some examples of proteins whose expression differed between the two samples. ATPB, ATP synthase β chain, mitochondrial;1433Z, 14-3-3 protein zeta/delta; GLNA, Glutamine synthetase; PHB, Prohibitin; SYPH, Synaptophysin; PSB7, Proteasome subunit β type 7; ERP29, Endoplasmic reticulum protein ERp29; TPIS, Triosephosphate isomerase.

References

    1. Sudhof TC. The synaptic vesicle cycle. Annu Rev Neurosci. 2004;27:509–547. doi: 10.1146/annurev.neuro.26.041002.131412. - DOI - PubMed
    1. Sheng M, Hoogenraad CC. The Postsynaptic Architecture of Excitatory Synapses: A More Quantitative View. Annu Rev Biochem. 2007;76:823–847. doi: 10.1146/annurev.biochem.76.060805.160029. - DOI - PubMed
    1. Bliss TV, Lomo T. Long-lasting potentiation of synaptic transmission in the dentate area of the anaesthetized rabbit following stimulation of the perforant path. J Physiol. 1973;232:331–356. - PMC - PubMed
    1. Reymann KG, Frey JU. The late maintenance of hippocampal LTP: requirements, phases, 'synaptic tagging', 'late-associativity' and implications. Neuropharmacology. 2007;52:24–40. doi: 10.1016/j.neuropharm.2006.07.026. - DOI - PubMed
    1. Frey U, Morris RG. Synaptic tagging: implications for late maintenance of hippocampal long-term potentiation. Trends Neurosci. 1998;21:181–188. doi: 10.1016/S0166-2236(97)01189-2. - DOI - PubMed

Publication types

LinkOut - more resources