Comparison between conventional and "clinical" assessment of experimental lung fibrosis
- PMID: 18402687
- PMCID: PMC2365932
- DOI: 10.1186/1479-5876-6-16
Comparison between conventional and "clinical" assessment of experimental lung fibrosis
Abstract
Background: Idiopathic pulmonary fibrosis (IPF) is a treatment resistant disease with poor prognosis. Numerous compounds have been demonstrated to efficiently prevent pulmonary fibrosis (PF) in animal models but only a few were successful when given to animals with established fibrosis. Major concerns of current PF models are spontaneous resolution and high variability of fibrosis, and the lack of assessment methods that can allow to monitor the effect of drugs in individual animals over time. We used a model of experimental PF in rats and compare parameters obtained in living animals with conventional assessment tools that require removal of the lungs.
Methods: PF was induced in rats by adenoviral gene transfer of transforming growth factor-beta. Morphological and functional changes were assessed for up to 56 days by micro-CT, lung compliance (measured via a mechanical ventilator) and VO2max and compared to histomorphometry and hydroxyproline content.
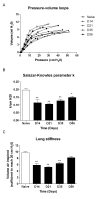
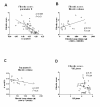
Results: Standard histological and collagen assessment confirmed the persistent fibrotic phenotype as described before. The histomorphological scores correlated both to radiological (r2 = 0.29, p < 0.01) and functional changes (r2 = 0.51, p < 0.0001). VO2max did not correlate with fibrosis.
Conclusion: The progression of pulmonary fibrosis can be reliably assessed and followed in living animals over time using invasive, non-terminal compliance measurements and micro-CT. This approach directly translates to the management of patients with IPF and allows to monitor therapeutic effects in drug intervention studies.
Figures


References
-
- Idiopathic Pulmonary Fibrosis: Diagnosis and Treatment. International Consensus Statement. Am J Respir Crit Care Med. 2000;161:646–664. - PubMed
-
- Thabut G, Mal H, Castier Y, Groussard O, Brugiere O, Marrash-Chahla R, Leseche G, Fournier M. Survival benefit of lung transplantation for patients with idiopathic pulmonary fibrosis. Journal of Thoracic and Cardiovascular Surgery. 2003;126:469–475. doi: 10.1016/S0022-5223(03)00600-7. - DOI - PubMed
-
- Moeller A, Rodriguez-Lecompte JC, Wang L, Gauldie J, Kolb M. Models of pulmonary fibrosis. Drug Discovery Today: Disease Models. 2006;3:243–249. doi: 10.1016/j.ddmod.2006.09.006. - DOI
Publication types
MeSH terms
Substances
LinkOut - more resources
Full Text Sources
Medical

