

Gene expression analyses in maize inbreds and hybrids with varying levels of heterosis
- PMID: 18402703
- PMCID: PMC2365949
- DOI: 10.1186/1471-2229-8-33
Gene expression analyses in maize inbreds and hybrids with varying levels of heterosis
Abstract
Background: Heterosis is the superior performance of F1 hybrid progeny relative to the parental phenotypes. Maize exhibits heterosis for a wide range of traits, however the magnitude of heterosis is highly variable depending on the choice of parents and the trait(s) measured. We have used expression profiling to determine whether the level, or types, of non-additive gene expression vary in maize hybrids with different levels of genetic diversity or heterosis.
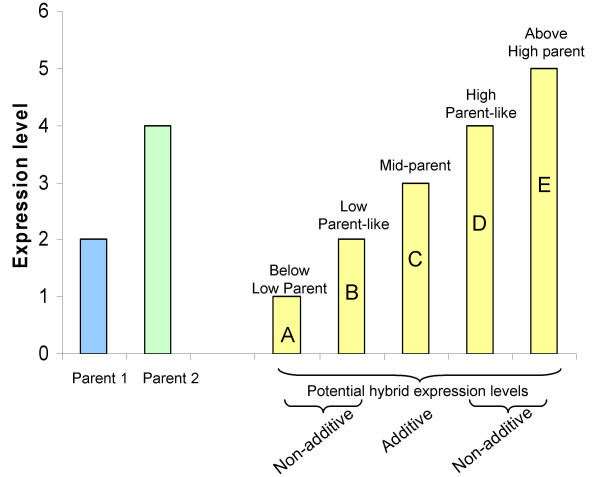
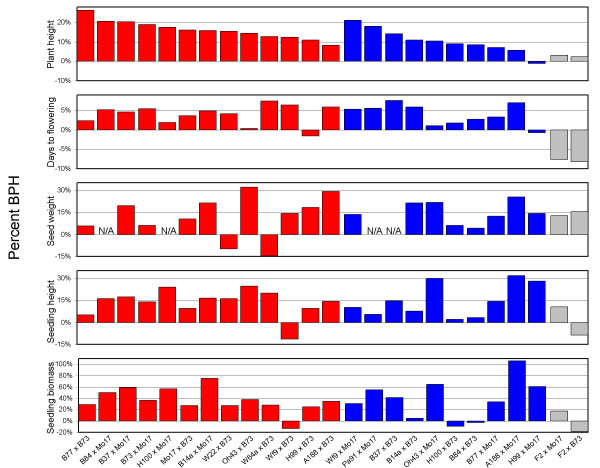
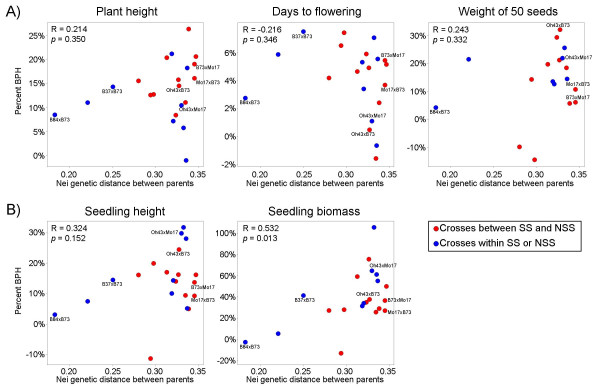
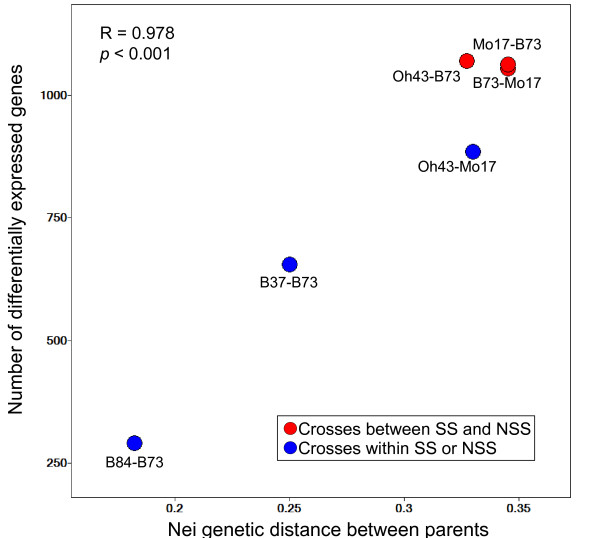
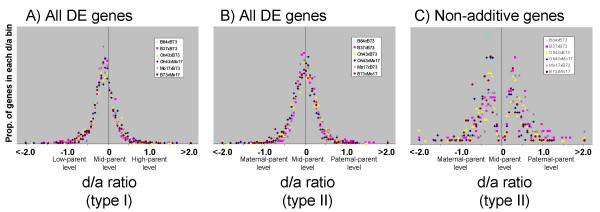
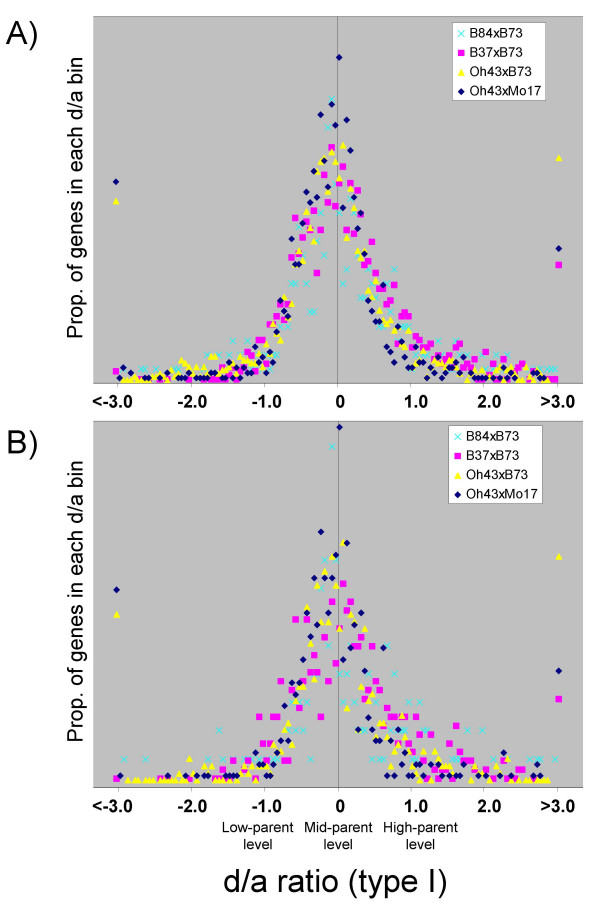
Results: We observed that the distributions of better parent heterosis among a series of 25 maize hybrids generally do not exhibit significant correlations between different traits. Expression profiling analyses for six of these hybrids, chosen to represent diversity in genotypes and heterosis responses, revealed a correlation between genetic diversity and transcriptional variation. The majority of differentially expressed genes in each of the six different hybrids exhibited additive expression patterns, and approximately 25% exhibited statistically significant non-additive expression profiles. Among the non-additive profiles, approximately 80% exhibited hybrid expression levels between the parental levels, approximately 20% exhibited hybrid expression levels at the parental levels and ~1% exhibited hybrid levels outside the parental range.
Conclusion: We have found that maize inbred genetic diversity is correlated with transcriptional variation. However, sampling of seedling tissues indicated that the frequencies of additive and non-additive expression patterns are very similar across a range of hybrid lines. These findings suggest that heterosis is probably not a consequence of higher levels of additive or non-additive expression, but may be related to transcriptional variation between parents. The lack of correlation between better parent heterosis levels for different traits suggests that transcriptional diversity at specific sets of genes may influence heterosis for different traits.
Figures
Similar articles
-
Heterosis is prevalent for multiple traits in diverse maize germplasm.PLoS One. 2009 Oct 13;4(10):e7433. doi: 10.1371/journal.pone.0007433. PLoS One. 2009. PMID: 19823591 Free PMC article.
-
Relationship between differential gene expression patterns in functional leaves of maize inbreds & hybrids at spikelet differentiation stage and heterosis.Yi Chuan Xue Bao. 2003 Feb;30(2):154-62. Yi Chuan Xue Bao. 2003. PMID: 12776604
-
Comparative proteomic analysis reveals that the Heterosis of two maize hybrids is related to enhancement of stress response and photosynthesis respectively.BMC Plant Biol. 2021 Jan 9;21(1):34. doi: 10.1186/s12870-020-02806-5. BMC Plant Biol. 2021. PMID: 33422018 Free PMC article.
-
Molecular dissection of heterosis in cereal roots and their rhizosphere.Theor Appl Genet. 2023 Jul 20;136(8):173. doi: 10.1007/s00122-023-04419-6. Theor Appl Genet. 2023. PMID: 37474870 Free PMC article. Review.
-
Biochemical analyses of inbreds and their heterotic hybrids in maize.Prog Clin Biol Res. 1990;344:639-64. Prog Clin Biol Res. 1990. PMID: 2203058 Review.
Cited by
-
Transcriptome profiling and comparison of maize ear heterosis during the spikelet and floret differentiation stages.BMC Genomics. 2016 Nov 22;17(1):959. doi: 10.1186/s12864-016-3296-8. BMC Genomics. 2016. PMID: 27875998 Free PMC article.
-
Comparative transcriptome analysis among parental inbred and crosses reveals the role of dominance gene expression in heterosis in Drosophila melanogaster.Sci Rep. 2016 Mar 1;6:21124. doi: 10.1038/srep21124. Sci Rep. 2016. PMID: 26928435 Free PMC article.
-
Single-Parent Expression of Anti-sense RNA Contributes to Transcriptome Complementation in Maize Hybrid.Front Plant Sci. 2020 Dec 3;11:577274. doi: 10.3389/fpls.2020.577274. eCollection 2020. Front Plant Sci. 2020. PMID: 33343593 Free PMC article.
-
Nonadditive gene expression is correlated with nonadditive phenotypic expression in interspecific triploid hybrids of willow (Salix spp.).G3 (Bethesda). 2022 Mar 4;12(3):jkab436. doi: 10.1093/g3journal/jkab436. G3 (Bethesda). 2022. PMID: 35100357 Free PMC article.
-
Inheritance of gene expression throughout fruit development in chili pepper.Sci Rep. 2021 Nov 22;11(1):22647. doi: 10.1038/s41598-021-02151-z. Sci Rep. 2021. PMID: 34811443 Free PMC article.
References
-
- East EM. Inbreeding in corn. Rep Connecticut Agric Exp Stn. 1908;1907:419–429.
-
- Shull GH. The composition of a field of maize. American Breeders Assoc Rep. 1908;4:296–301.
-
- Melchinger AE. Genetic diversity and heterosis. In: Coors JG, Staub JE, editor. The genetics and exploitation of heterosis and crop plants. Madison, WI: Crop Science Society of America; 1999. pp. 99–118.
-
- Tracy WF, Chandler MA. The Historical and Biological Basis of the Concept of Heterotic Patterns in Corn Belt Dent Maize. In: Lamkey K, Lee M, editor. Plant Breeding: The Arnel Hallauer International Symposium. Ames, IA: Blackwell Pub; 2006. pp. 219–233.
-
- Melchinger AE, Gumber RK. Overview of heterosis and heterotic crops in agronomic crops. In: Lamkey KL, Staub JE, editor. Concepts and breeding of heterotic crop plants. Madison, WI: Crop Science Society of America; 1998. pp. 29–44.
Publication types
MeSH terms
LinkOut - more resources
Full Text Sources
Other Literature Sources
Molecular Biology Databases
