

Association between dietary glycemic index, glycemic load, and high-sensitivity C-reactive protein
- PMID: 18402914
- PMCID: PMC2405890
- DOI: 10.1016/j.nut.2007.12.017
Association between dietary glycemic index, glycemic load, and high-sensitivity C-reactive protein
Abstract
Objective: This study examined the relation between quality of dietary carbohydrate intake, as measured by glycemic index (GI) and glycemic load (GL), and serum high-sensitivity C-reactive protein (hs-CRP) levels.
Methods: During a 1-y observational study, data were collected at baseline and at each quarter thereafter. GI and GL were calculated from multiple 24-h dietary recalls (24HRs), 3 randomly selected 24HRs at every quarter, with up to 15 24HRs per participant. The hs-CRP was measured in blood samples collected at baseline and each of the four quarterly measurement points. Multivariable linear mixed models were used to examine the cross-sectional and longitudinal associations of GI, GL, and hs-CRP.
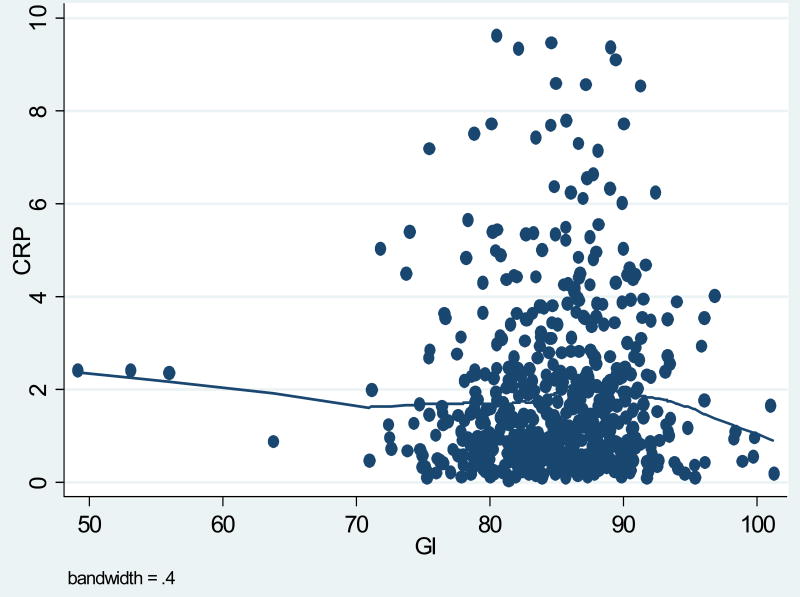
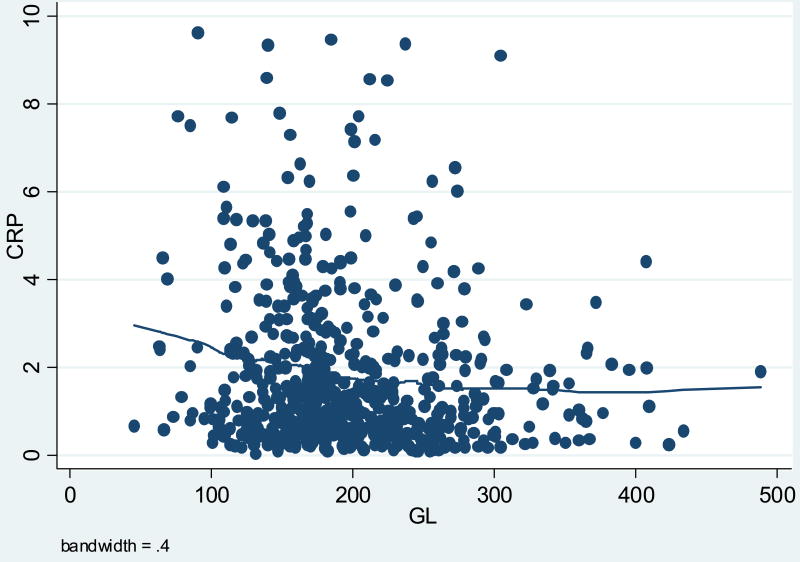
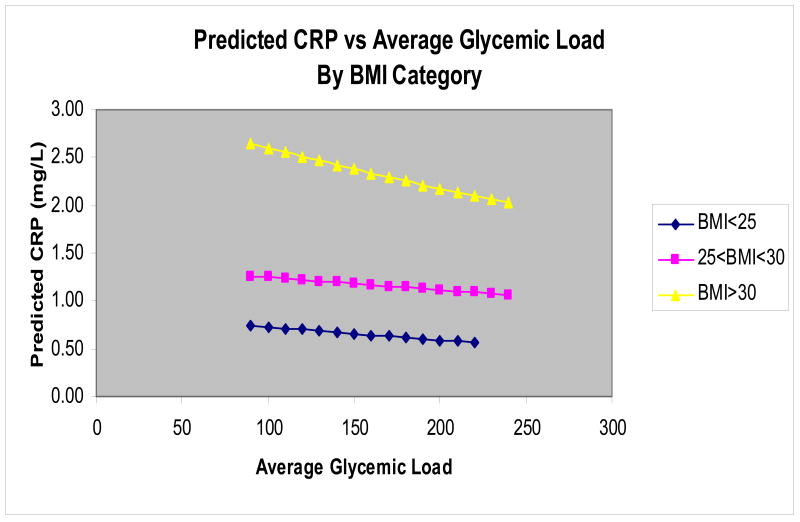
Results: Among 582 adult men and women with at least two measurements of diet and hs-CRP, average daily GI score (white bread = 100) was 85 and average GL was 198, and average hs-CRP was 1.84 mg/L. Overall, there was no association between GI or GL and hs-CRP. Subgroup analyses revealed an inverse association between GL and hs-CRP among obese individuals (body mass index > or =30 kg/m(2)).
Conclusion: Quality of dietary carbohydrates does not appear to be associated with serum hs-CRP levels. Among obese individuals, higher dietary GL appears to be related to lower hs-CRP levels. Due to the limited number of studies on this topic and their conflicting results, further investigation is warranted.
Figures
References
-
-
www.cdc.gov/nchs/faststats/heart.htm Accessed April 15, 2007
-
-
-
www.cdc.gov/diabetes/pubs/estimates05.htm Accessed April 15, 2007
-
-
-
www.diabetes.org/diabetes-heart-disease-stroke.jsp Accessed April 15, 2007
-
-
- Ridker PM, Buring JE, Shih J, Matias M, Hennekens CH. Prospective study of C-reactive protein and risk of future cardiovascular events among apparently healthy women. Circulation. 1998;98:731–733. - PubMed
-
- Koenig W, Sund M, Frohlich M, Fischer HG, Lowel H, Doring A, Hutchinson WL. C-reactive protein, a sensitive marker of inflammation, predicts future risk of coronary heart disease in initially healthy middle-aged men. Circulation. 1999;99:237–242. - PubMed
Publication types
MeSH terms
Substances
Grants and funding
LinkOut - more resources
Full Text Sources
Medical
Research Materials
Miscellaneous
