. 2008 Jun 20;283(25):17463-76.
doi: 10.1074/jbc.M710014200. Epub 2008 Apr 10.

Coupling between ATP binding and DNA cleavage by DNA topoisomerase II: A unifying kinetic and structural mechanism

Affiliations

Coupling between ATP binding and DNA cleavage by DNA topoisomerase II: A unifying kinetic and structural mechanism

Felix Mueller-Planitz et al. J Biol Chem. .

Abstract

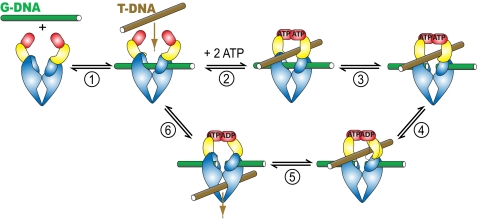
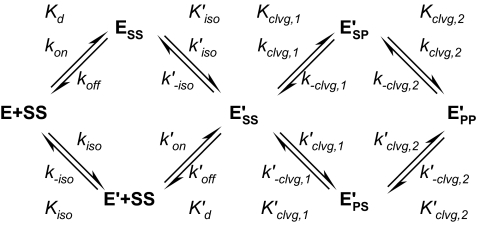
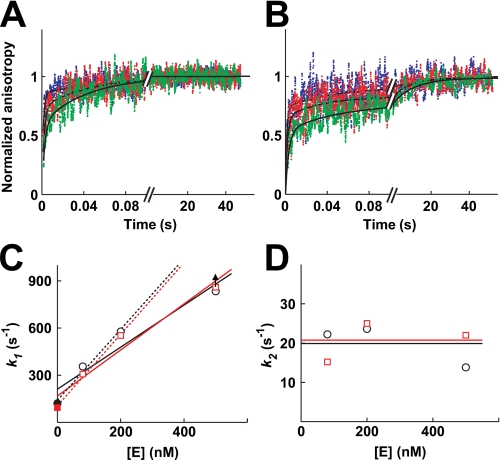
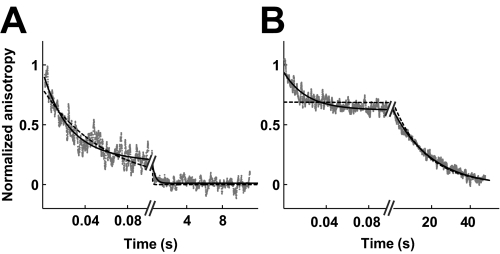
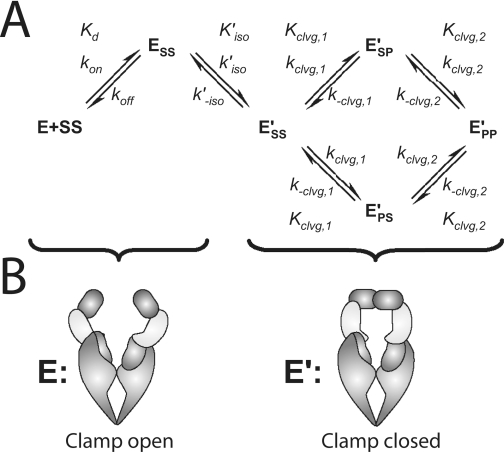
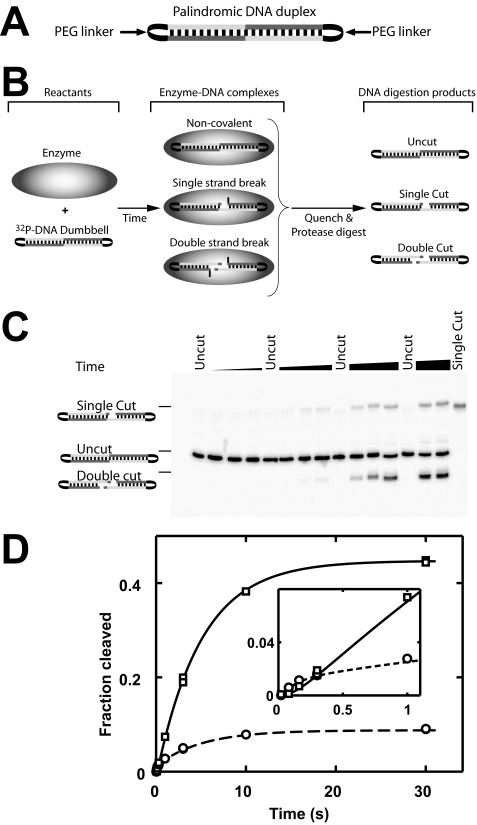
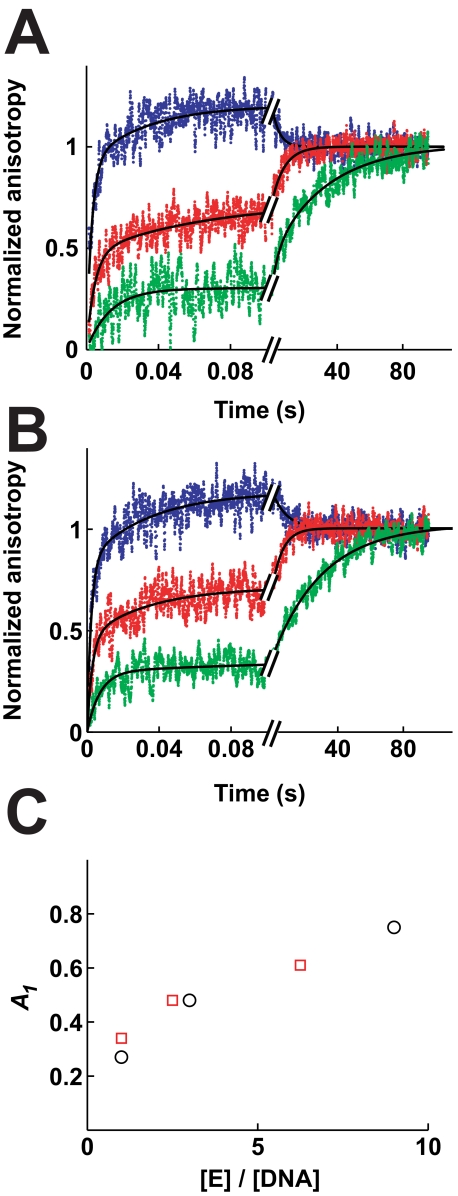
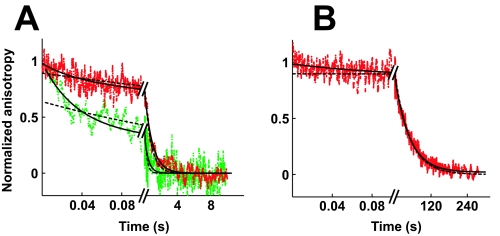
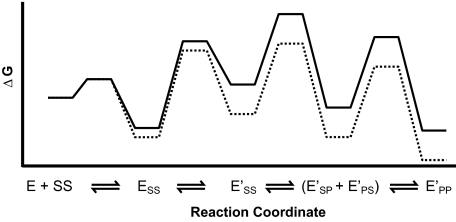
DNA topoisomerase II is a molecular machine that couples ATP hydrolysis to the transport of one DNA segment through a transient break in another segment. To learn about the energetic connectivity that underlies this coupling, we investigated how the ATPase domains exert control over DNA cleavage. We dissected the DNA cleavage reaction by measuring rate and equilibrium constants for the individual reaction steps utilizing defined DNA duplexes in the presence and absence of the nonhydrolyzable ATP analog 5'-adenylyl-beta,gamma-imidodiphosphate (AMPPNP). Our results revealed the existence of two enzyme conformations whose relative abundance is sensitive to the presence of nucleotides. The predominant species in the absence of nucleotides binds DNA at a diffusion limited rate but cannot efficiently cleave DNA. In the presence of AMPPNP, most of the enzyme is converted to a state in which DNA binding and release is extremely slow but which allows DNA cleavage. A minimal kinetic and thermodynamic framework is established that accounts for the cooperativity of cleavage of the two DNA strands in the presence and absence of bound AMPPNP and includes conformational steps revealed in the kinetic studies. The model unifies available kinetic, thermodynamic, and structural data to provide a description for the reaction in terms of the order and rate of individual reaction steps and the physical nature of the species on the reaction path. Furthermore, this reaction framework provides a foundation for a future in-depth analysis of energy transduction by topoisomerase II, for guiding and interpreting future structural studies, and for analyzing the mechanism of drugs that convert topoisomerase into a cellular poison.


Figures

FIGURE 1.
FIGURE 1.
Model of the topoisomerase II-catalyzed DNA transport reaction. Individual steps are described in the Introduction and under “Results and Discussion.” ATP binding (GHKL) domains are colored red, transducer domains yellow, DNA cleavage domains blue, G-DNA green, and T-DNA brown.
SCHEME 1
SCHEME 1
FIGURE 2.
FIGURE 2.
Binding of DNA to nucleotide-free enzyme. The association of enzyme and DNA was measured by rapidly mixing fluorophore-labeled DNA with enzyme and following the increase of the anisotropy over time by stopped flow fluorescence anisotropy in Mg2+ (A) and Ca2+ (B). The individual binding reactions were repeated 8–18 times and the data averaged. A, final concentrations used were 80 nm fluorophore-labeled DNA with 80 nm (green), 200 nm (red) or 500 nm (blue) enzyme. The data in Mg2+ (A) were fit to a double exponential expression (Equation 2; solid lines), giving best fit values k1 = 350 s-1, A1 = 0.61, k2 = 22 s-1, A2 = 0.39 (green); k1 = 580 s-1, A1 = 0.72, k2 = 24 s-1, A2 = 0.28 (red); k1 = 830 s-1, A1 = 0.86, k2 = 14 s-1, A2 = 0.14 (blue). The kinetic traces in Ca2+ (B) were fit to a triple exponential expression (Equation 3; solid lines). Best fit values are as follows: k1 = 310 s-1, A1 = 0.55, k2 = 15 s-1, A2 = 0.24, k3 = 0.07 s-1, A3 = 0.20 (green); k1 = 550 s-1, A1 = 0.67, k2 = 25 s-1, A2 = 0.17, k3 = 0.1 s-1, A3 = 0.15 (red); k1 = 890 s-1, A1 = 0.73, k2 = 14 s-1, A2 = 0.18, k3 = 0.04 s-1, A3 = 0.09 (blue). C, value of k1 depends linearly on the enzyme concentration in Mg2+ (circles) and Ca2+ (squares). Values for k1 are taken from A and B (open symbols). In addition, k1 in the absence of enzyme is approximated by the observed dissociation rate constant (closed symbols; Fig. 3). The data were fit with a line of slope 1.3 * 109 m-1 s-1 (Mg2+) and 1.5 * 109 m-1 s-1 (Ca2+). The value for k1 at the highest enzyme concentration may represent a lower limit (arrow) because of dead time of the instrument for mixing. Omitting these data points from the fits, the slopes of both lines increase to 2.3 * 109 m-1 s-1 (dashed lines). D, value of k2 is independent of the enzyme concentration. Lines indicate the mean. Symbols as in C.
FIGURE 3.
FIGURE 3.
Dissociation of DNA from nucleotide-free enzyme. Dissociation of enzyme and DNA was followed by stopped flow fluorescence anisotropy in Mg2+ (A) and Ca2+ (B). The enzyme and fluorophore-labeled 40-bp DNA were first equilibrated at the given concentrations to allow them to associate before the mixture was chased with excess unlabeled DNA. Data from four (A) and seven (B) separate injections were averaged. A, mixture of enzyme (900 nm) and fluorophore-labeled DNA (500 nm) was chased with excess unlabeled DNA. Solid line, double exponential fit (Equation 2; k1 = 120 s-1; A1 = 0.56; k2 = 9 s-1; A2 = 0.44). The use of a double exponential instead of a single exponential to describe the data is statistically warranted (p < 2 × 10⁻⁴; f test). B, mixture of enzyme (600 nm) and fluorophore-labeled DNA (300 nm) was chased with excess unlabeled DNA. Solid line, double exponential fit (Equation 2; k1 = 90 s-1; A1 = 0.3; k2 = 0.055 s-1; A2 = 0.7). Dashed black lines, single exponential fits for comparison.
SCHEME 2
SCHEME 2
FIGURE 4.
FIGURE 4.
DNA cleavage of dumbbell DNA mediated by nucleotide-free enzyme. A, schematic of the palindromic DNA dumbbell used as a cleavage substrate. The 5′- and 3′-ends of the duplex are covalently connected by triethylene glycol linkers (PEG). B, work flow of the DNA cleavage assay. Upon mixing of enzyme and 32P-labeled DNA, the specified covalent and noncovalent enzyme-DNA complexes are formed. After quenching the reaction mixture, the DNA was liberated from the covalent enzyme-DNA complexes by protease digestion before the mixture was separated by denaturing PAGE. C, cleavage time course of 1 nm dumbbell DNA using 900 nm enzyme. Uncut dumbbell DNA and pure single cut DNA were loaded as controls. D, quantification of the gel shown in C. Single strand breaks, circles; double strand breaks, squares. Time courses obtained with a 3-fold lower enzyme concentration gave results that were the same within 10%, indicating that saturating enzyme concentrations were used (supplemental Fig. S8). Lines represent a global fit of the time courses to Scheme 1. Estimates for individual rate constants are summarized in Table 2.
FIGURE 5.
FIGURE 5.
Binding of DNA to AMPPNP-bound enzyme. The association of enzyme and DNA was measured in Mg2+ (A) and Ca2+ (B) as in Fig. 2. Data from 9–23 separate injections were averaged for each experiment. A, 50 nm fluorophore-labeled DNA was rapidly mixed with 50 nm (green), 150 nm (red)/or 450 nm enzyme (blue, final concentrations). Lines, triple exponential fits with k1 = 100 s-1, k2 = 5 s-1, k3 = 0.04 s-1 (green); k1 = 210 s-1, k2 = 14 s-1, k3 = 0.13 s-1 (red); k1 = 400 s-1, k2 = 15 s-1, k3 = 0.23 s-1 (blue). B, 80 nm ROX-labeled DNA was rapidly mixed with 80 nm (green), 200 nm (red), or 500 nm enzyme (blue). Lines, triple exponential fits with k1 = 200 s-1, k2 = 9 s-1, k3 = 0.03 s-1 (green); k1 = 320 s-1, k2 = 27 s-1, k3 = 0.15 s-1 (red); k1 = 370 s-1, k2 = 16 s-1, k3 = 0.15 s-1 (blue). C, relative amplitude of the initial phase (A1) increases with increasing enzyme to DNA ratios. Values for A1 were taken from fits in A (circles) and B (squares).
FIGURE 6.
FIGURE 6.
Dissociation of DNA from AMPPNP-bound enzyme. Dissociation in Mg2+ (A) and Ca2+ (B) is measured as in Fig. 3. Data from 7 to 11 separate injections were averaged for each experiment. A, enzyme and fluorophore-labeled DNA were allowed to react for 70 ms (green) or >1 min (red) before the reaction mixture was chased with excess unlabeled DNA. Enzyme concentrations before the chase were 400 nm (green) and 350 nm (red). Fluorophore-labeled DNA concentrations were 100 nm (green) and 240 nm (red). Solid lines, double exponential fits (Equation 2). Best fit values are as follows: k1 = 19 s-1, A1 = 0.18, k2 = 1.0 s-1, A2 = 0.82; (red) and k1 = 31 s-1, A1 = 0.58; k2 = 2.2 s-1, A2 = 0.42 (green). B, enzyme (350 nm) and ROX-labeled DNA (280 nm) were mixed and equilibrated before the mixture was chased as above. The data are fit to a double exponential expression (k1 = 27 s-1; A1 = 0.15; k2 = 0.023 s-1; A2 = 0.85). Dashed line, single exponential fits for comparison.
FIGURE 7.
FIGURE 7.
DNA cleavage time courses of dumbbell DNA in the presence of saturating concentrations of AMPPNP. 300 nm (diamonds and triangles) or 900 nm enzyme (squares and circles) was preincubated with AMPPNP and then mixed rapidly with 1 nm DNA dumbbell (final concentrations). The formation of single (circles and diamonds) and double strand breaks (squares and triangles) was measured as described in Fig. 4. The right panel depicts the formation of the single strand break within the first 300 ms and reveals that formation of the single strand break follows a kinetic lag. Varying the enzyme concentrations between 300 and 900 nm has no noticeable effect on the kinetic lag. Solid and broken lines represent a global fit of the time courses to Scheme 2A. A kinetic lag is not obtained in fits of the data to a simpler model lacking a conformational step prior to cleavage of the first DNA strand (dotted line; supplemental Scheme S3).
FIGURE 8.
FIGURE 8.
Free energy profile for the DNA cleavage reaction catalyzed by the nucleotide-free (solid line) and the AMPPNP-bound enzyme (dotted line). Rate constants were taken from supplemental Fig. S6. To better visualize the free energy changes of the different species, all free energy barriers were proportionally shortened by multiplying each rate constant by 109. The standard state is 1 μm enzyme.

Similar articles

Cited by

References

    1. Vale, R. D. (2003) Cell 112 467-480 - PubMed
    1. Alberts, B. (1998) Cell 92 291-294 - PubMed
    1. Bustamante, C., Keller, D., and Oster, G. (2001) Acc. Chem. Res. 34 412-420 - PubMed
    1. Wang, J. C. (1996) Annu. Rev. Biochem. 65 635-692 - PubMed
    1. Brown, P. O., and Cozzarelli, N. R. (1979) Science 206 1081-1083 - PubMed

Publication types

LinkOut - more resources