

Resting-state functional connectivity reflects structural connectivity in the default mode network
- PMID: 18403396
- PMCID: PMC2605172
- DOI: 10.1093/cercor/bhn059
Resting-state functional connectivity reflects structural connectivity in the default mode network
Abstract
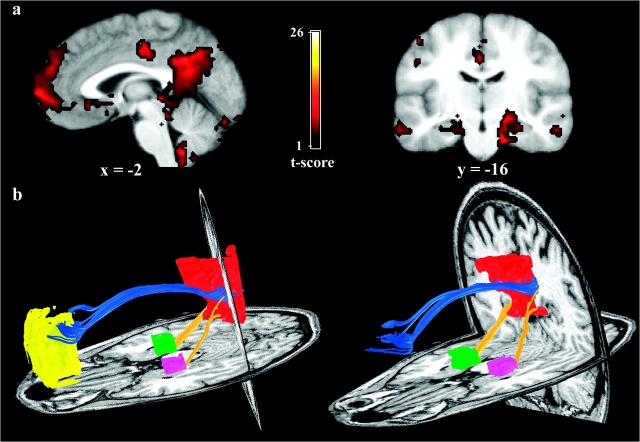
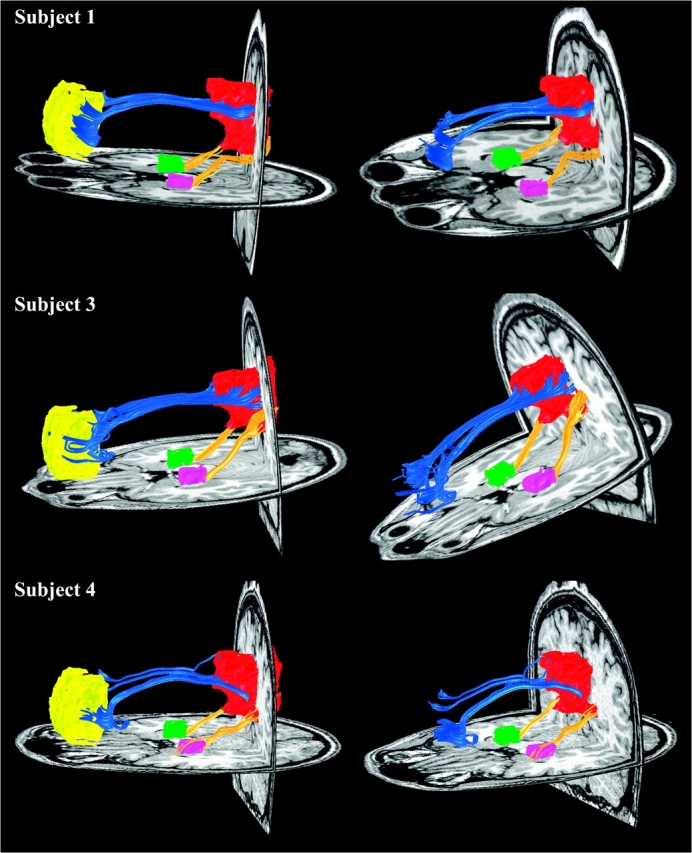
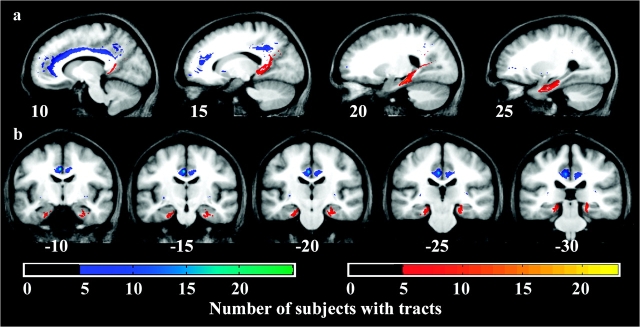
Resting-state functional connectivity magnetic resonance imaging (fcMRI) studies constitute a growing proportion of functional brain imaging publications. This approach detects temporal correlations in spontaneous blood oxygen level-dependent (BOLD) signal oscillations while subjects rest quietly in the scanner. Although distinct resting-state networks related to vision, language, executive processing, and other sensory and cognitive domains have been identified, considerable skepticism remains as to whether resting-state functional connectivity maps reflect neural connectivity or simply track BOLD signal correlations driven by nonneural artifact. Here we combine diffusion tensor imaging (DTI) tractography with resting-state fcMRI to test the hypothesis that resting-state functional connectivity reflects structural connectivity. These 2 modalities were used to investigate connectivity within the default mode network, a set of brain regions--including medial prefrontal cortex (MPFC), medial temporal lobes (MTLs), and posterior cingulate cortex (PCC)/retropslenial cortex (RSC)--implicated in episodic memory processing. Using seed regions from the functional connectivity maps, the DTI analysis revealed robust structural connections between the MTLs and the retrosplenial cortex whereas tracts from the MPFC contacted the PCC (just rostral to the RSC). The results demonstrate that resting-state functional connectivity reflects structural connectivity and that combining modalities can enrich our understanding of these canonical brain networks.
Figures
References
-
- Alexander DC, Pierpaoli C, Basser PJ, Gee JC. Spatial transformations of diffusion tensor magnetic resonance images. IEEE Trans Med Imaging. 2001;20:1131–1139. - PubMed
-
- Ashburner J, Friston KJ. 2003. Human Brain Function. New York: Academic.
-
- Basser PJ. Inferring microstructural features and the physiological state of tissues from diffusion-weighted images. NMR Biomed. 1995;8:333–344. - PubMed
-
- Basser PJ, Pajevic S, Pierpaoli C, Duda J, Aldroubi A. In vivo fiber tractography using DT-MRI data. Magn Reson Med. 2000;44:625–632. - PubMed
-
- Basser PJ, Pierpaoli C. Microstructural and physiological features of tissues elucidated by quantitative-diffusion-tensor MRI. J Magn Reson B. 1996;111:209–219. - PubMed
Publication types
MeSH terms
Grants and funding
LinkOut - more resources
Full Text Sources
Other Literature Sources
Medical
