Comparative Study
. 2008 Aug;29(7):1288-95.
doi: 10.3174/ajnr.A1073. Epub 2008 Apr 10.

Multiphase CT angiography versus single-phase CT angiography: comparison of image quality and radiation dose

Affiliations
Comparative Study

Multiphase CT angiography versus single-phase CT angiography: comparison of image quality and radiation dose

C-Y Yang et al. AJNR Am J Neuroradiol. 2008 Aug.

Abstract

Background and purpose: Conventional CT angiography (CTA) is acquired during only a short interval in the arterial phase, which limits its ability to evaluate the cerebral circulation. Our aim was to compare the image quality and radiation dose of conventional single-phase CTA (SP-CTA) with a multiphase CTA (MP-CTA) algorithm reconstructed from a perfusion CT (PCT) dataset.

Materials and methods: Fifty consecutive patients undergoing head CTA and PCT in 1 examination were enrolled. The PCT dataset was obtained with 40.0-mm-detector coverage, 5.0-mm axial thickness, 80 kilovolt peak (kVp), 180 mA, and 30 mL of contrast medium. MP-CTA was reconstructed from the same PCT dataset with an axial thickness of 0.625 mm by using a new axial reconstruction algorithm. A conventional SP-CTA dataset was obtained with 0.625-mm axial thickness, 120 kVp, 350 mA, and 60 mL of contrast medium. We compared image quality, vascular enhancement, and radiation dose.

Results: SP-CTA and MP-CTA of 50 patients (male/female ratio, 31/19; mean age, 59.25 years) were analyzed. MP-CTA was significantly better than SP-CTA in vascular enhancement (P = .002), in the absence of venous contamination (P = .006), and was significantly higher in image noise (P < .001). MP-CTA used less contrast medium than SP-CTA and could demonstrate hemodynamic information. The effective dose of MP-CTA was 5.73 mSv, which was equal to that in conventional PCT, and it was 3.57 mSv in SP-CTA.

Conclusion: It is feasible that MP-CTA may provide both CTA and PCT results. Compared with SP-CTA, MP-CTA provides comparable image quality, better vascular enhancement, hemodynamic information, and more noise with less detail visibility with a lower tube voltage. The radiation dose of MP-CTA is higher than that of SP-CTA, but the dose can be reduced by altering the sampling interval.


Figures
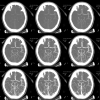
Fig 1.
Fig 1.
Sequential images of MP-CTA are displayed to show the flow dynamics of a patient with suggested stroke. The right MCA is not initially enhanced in the early arterial phase, and opacification of the distal branches of the right MCA via the collaterals can be appreciated later. The temporal sequence of enhancement also helps differentiate arteries and veins (window/level = 1000/100).
Fig 2.
Fig 2.
Sequential images of MP-CTA are displayed to show flow dynamics of a case of DAVF. Increased early draining veins around the left Sylvian fissure, as well as the mildly engorged deep venous drainage, could be observed on the left side (window/level = 1000/100).
Fig 3.
Fig 3.
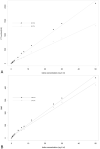
Graph shows CT number as a function of iodine concentration. A, The linear relationships for 2 tube-voltage settings are as follows: at 80 kVp/180 mAs, y = 43.25x + 48.05 (r = 0.997); and at 120 kVp/350 mAs, y = 27.55x + 24.00 (r = 0.996). B, The relationship between iodine concentration and SNR is as follows: for SP-CTA, SNR = 8.577 × iodine concentration +12.864 (r = 0.985); for MP-CTA, SNR = 9.704 × iodine concentration + 13.573 (r = 0.973).
Fig 4.
Fig 4.
Boxplot of arterial attenuation in 50 patients scanned with both SP-CTA and MP-CTA protocols. Error bars indicate the range of values of arterial attenuation. Boxes contain all values within the 25th–75th percentiles (interquartile range), and thick black lines represent the median. The arterial enhancement peak phase of the MP-CTA is shown for comparison. A, Boxplot of attenuation of the exact same region of the largest artery in the scanning range, representing enhancement in the large vessel. The 3 circles are outliers measured in 1 patient. B, Boxplot of attenuation of the exact same region of the M2 segment in the scanning range, representing enhancement in the small vessel.
Fig 5.
Fig 5.
Comparison of image quality between MP-CTA and SP-CTA. A single section of MP-CTA (A), SP-CTA (B), and MIP reconstruction of MP-CTA (C) and SP-CTA (D) is demonstrated. The MP-CTA images were acquired 10–15 minutes after the SP-CTA; therefore, we could find images at almost the same level for comparison. The phase of maximal arterial enhancement of MP-CTA was selected. Higher attenuation of the vascular opacification is easily appreciated in the MP-CTA. Note that venous contamination in the SP-CTA is greater than that in the MP-CTA, which is more obvious in MIP images; and it may interfere with the differentiation of the arteries and veins. The occlusion of right MCA can be detected in both methods. The MP-CTA is noisier, and the contour of the vessels appears coarser than that in SP-CTA. All images were presented with the same window setting (window/level = 1000/100).

References

    1. Villablanca JP, Jahan R, Hooshi P, et al. Detection and characterization of very small cerebral aneurysms by using 2D and 3D helical CT angiography. AJNR Am J Neuroradiol 2002;23:1187–98 - PMC - PubMed
    1. Wintermark M, Uske A, Chalaron M, et al. Multislice computerized tomography angiography in the evaluation of intracranial aneurysms: a comparison with intraarterial digital subtraction angiography. J Neurosurg 2003;98:828–36 - PubMed
    1. Sylaja PN, Dzialowski I, Krol A, et al. Role of CT angiography in thrombolysis decision-making for patients with presumed seizure at stroke onset. Stroke 2006;37:915–17 - PubMed
    1. Binaghi S, Colleoni ML, Maeder P, et al. CT angiography and perfusion CT in cerebral vasospasm after subarachnoid hemorrhage. AJNR Am J Neuroradiol 2007;28:750–58 - PMC - PubMed
    1. Wada R, Aviv RI, Fox AJ, et al. CT angiography “spot sign” predicts hematoma expansion in acute intracerebral hemorrhage. Stroke 2007;38:1257–62 - PubMed

Publication types

MeSH terms