Comparative Study
. 2008 May;172(5):1363-80.
doi: 10.2353/ajpath.2008.070851. Epub 2008 Apr 10.

Cross-species comparison of human and mouse intestinal polyps reveals conserved mechanisms in adenomatous polyposis coli (APC)-driven tumorigenesis

Affiliations
Comparative Study

Cross-species comparison of human and mouse intestinal polyps reveals conserved mechanisms in adenomatous polyposis coli (APC)-driven tumorigenesis

Claudia Gaspar et al. Am J Pathol. 2008 May.

Abstract

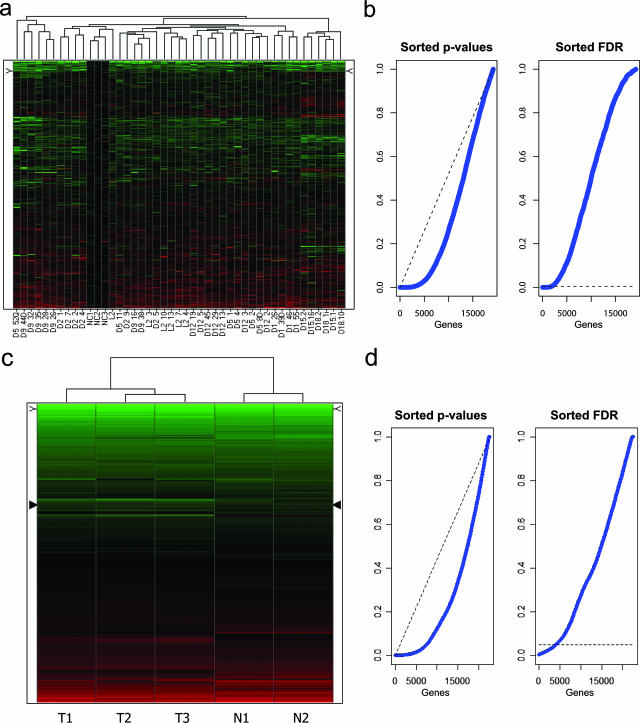
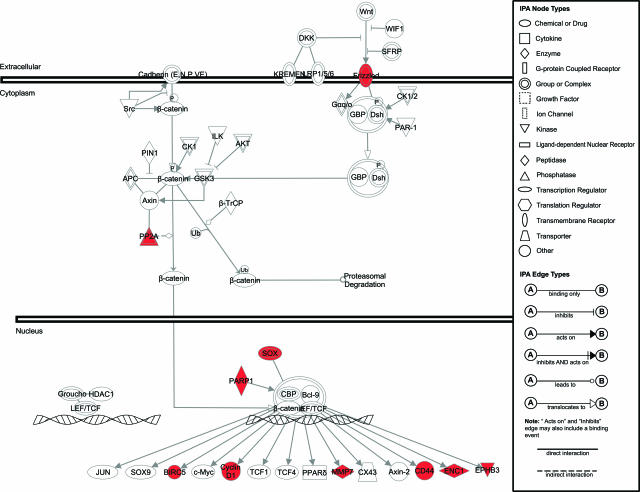
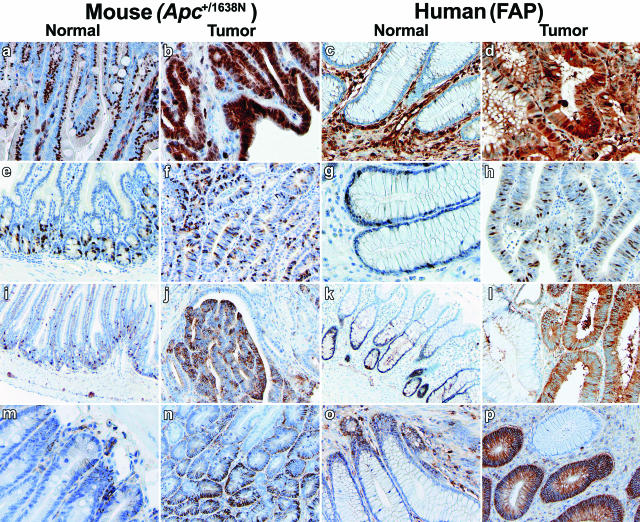
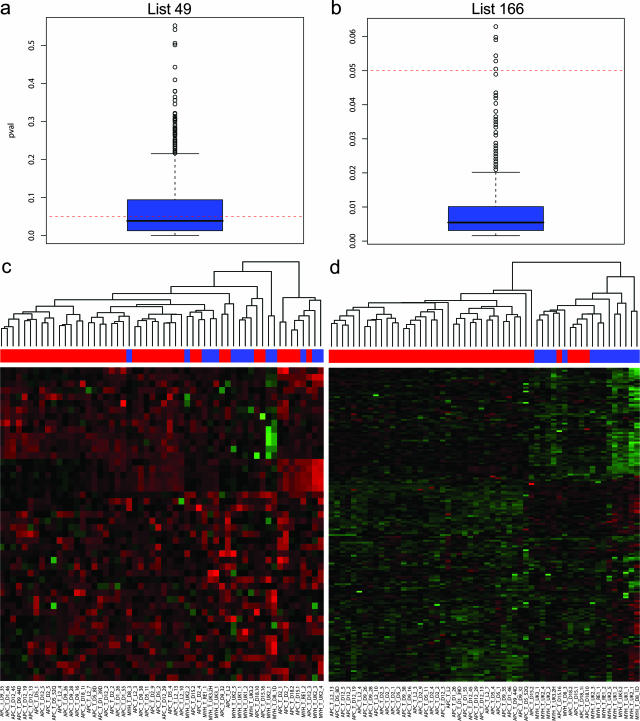
Expression profiling is a well established tool for the genome-wide analysis of human cancers. However, the high sensitivity of this approach combined with the well known cellular and molecular heterogeneity of cancer often result in extremely complex expression signatures that are difficult to interpret functionally. The majority of sporadic colorectal cancers are triggered by mutations in the adenomatous polyposis coli (APC) tumor suppressor gene, leading to the constitutive activation of the Wnt/beta-catenin signaling pathway and formation of adenomas. Despite this common genetic basis, colorectal cancers are very heterogeneous in their degree of differentiation, growth rate, and malignancy potential. Here, we applied a cross-species comparison of expression profiles of intestinal polyps derived from hereditary colorectal cancer patients carrying APC germline mutations and from mice carrying a targeted inactivating mutation in the mouse homologue Apc. This comparative approach resulted in the establishment of a conserved signature of 166 genes that were differentially expressed between adenomas and normal intestinal mucosa in both species. Functional analyses of the conserved genes revealed a general increase in cell proliferation and the activation of the Wnt/beta-catenin signaling pathway. Moreover, the conserved signature was able to resolve expression profiles from hereditary polyposis patients carrying APC germline mutations from those with bi-allelic inactivation of the MYH gene, supporting the usefulness of such comparisons to discriminate among patients with distinct genetic defects.


Figures

Figure 1
Figure 1
Unsupervised hierarchical cluster analysis of expression profiles from human and mouse intestinal polyps, without preliminary gene selection. Up- and down-regulated probes are depicted in red and green, respectively. a: Unsupervised hierarchical clustering analysis of 42 colorectal adenomatous polyps (obtained from eight unrelated FAP patients with previously identified germline APC mutations23) and 3 control normal mucosa samples (labeled as NC1-3) obtained from individuals with no history of CRC. b: Distribution of P values (left plot) relative to the comparison of patient-derived colorectal adenomas versus normal mucosa samples, sorted in ascending order (blue line). The dashed (black) line represents what would be expected if no effect was detectable. In the right plot, FDR-adjusted sorted P values are shown. The dashed line represents the FDR threshold used in our study to select the differentially expressed genes in the human set that led to the selection of 1859 probes. c: Unsupervised hierarchical clustering analysis of duodenal adenomas (n = 3, labeled T1T3) and normal mucosa (n = 2, N1N2) samples obtained from inbred C57BL6/J Apc+/1638N and Apc+/+ mice, respectively. d: Distribution of P values (left plot) relative to the comparison of mouse duodenal adenomas versus normal tissue samples, sorted in ascending order (blue line). The dashed (black) line represents what would be expected if no effect was detectable. In the right plot, FDR-adjusted sorted P values are shown. The dashed line represents the FDR threshold used in our study to select the differentially expressed genes in the mouse set that led to the selection of 4137 probes.
Figure 2
Figure 2
IPA of the genes encompassed by the conserved 166 signatures and belonging to the Wnt signal transduction pathway. The canonical Wnt pathway from the IPA database was slightly modified to accommodate additional Wnt target genes., The signaling network is represented graphically as nodes (symbols representing genes) and lines/arrows (biological relationship between the genes according to the legend). Red and green gene symbols denote up- and down-regulated genes, respectively. White symbols denote genes not differentially expressed in the conserved signature.
Figure 3
Figure 3
Immunohistochemistry validation analysis of cross-species conserved genes. Human (colorectal polyps and normal mucosa from FAP patients carrying germline APC mutations) and mouse (duodenal adenomas and normal mucosa from inbred C57BL6/J Apc+/1638N and Apc+/+ mice) tissue sections were analyzed with specific antibodies (see Materials and Methods) for expression of the following proteins: ANXA1 (ad), CCNA2 (eh), MARCKSL1 (il), and CD44 (mp).
Figure 4
Figure 4
Analysis of the cross-species conserved signature as a tool to separate hereditary polyposis syndromes due to APC (FAP) or MYH (MAP) germline mutations. The globaltest was performed with the 49 (a)- and 166 (b)-gene signature and graphically represented by box plots of the P values generated after 1000 iterations in which only one random sample from each patient was used at a time. Box plots were generated using the standard settings present in R2.4.1. The filled blue boxes encompass the range of P values representative of 50% of the data points, whereas the central line represents the median. two-dimensional hierarchical clustering analysis was performed with the 49 (c)- and 166 (d)-gene signature, respectively, on the expression profiles obtained from all 56 colorectal adenomas (42 from APC and 14 from MYH gene mutation carriers). The colored bar above the heat map represents the mutation status of the corresponding polyp samples: red, polyps from patients carrying germline APC mutations; blue, polyps from patients carrying bi-allelic germline MYH mutations.

References

    1. de la Chapelle A. Genetic predisposition to colorectal cancer. Nat Rev Cancer. 2004;4:769–780. - PubMed
    1. Kinzler KW, Vogelstein B. Lessons from hereditary colorectal cancer. Cell. 1996;87:159–170. - PubMed
    1. Groden J, Thliveris A, Samowitz W, Carlson M, Gelbert L, Albertsen H, Joslyn G, Stevens J, Spirio L, Robertson M, Sargeant L, Krapcho K, Wolff E, Burt R, Hughes J, Warrington J, McPherson J, Wasmuth J, LePaslier D, Abderrahim H, Cohen D, Leppert M, White R. Identification and characterization of the familial adenomatous polyposis coli gene. Cell. 1991;66:589–600. - PubMed
    1. Joslyn G, Carlson M, Thliveris A, Albertsen H, Gelbert L, Samowitz W, Groden J, Stevens J, Spirio L, Robertson M, Sargeant L, Krapcho K, Wolff E, Burt R, Hughes JP, Warrington J, McPherson J, Wasmuth J, Le Paslier D, Abderrahim H, Cohen D, Leppert M, White R. Identification of deletion mutations and three new genes at the familial polyposis locus. Cell. 1991;66:601–613. - PubMed
    1. Kinzler KW, Nilbert MC, Vogelstein B, Bryan TM, Levy DB, Smith KJ, Preisinger AC, Hamilton SR, Hedge P, Markham A, Carlson M, Joslyn G, Groden J, White R, Miki Y, Miyoshi Y, Nishisho I, Nakamura Y. Identification of a gene located at chromosome 5q21 that is mutated in colorectal cancers. Science. 1991;251:1366–1370. - PubMed

Publication types

MeSH terms

Substances