. 2008 Apr 11;320(5873):201-5.
doi: 10.1126/science.1152089.

Surface mobility of postsynaptic AMPARs tunes synaptic transmission

Affiliations

Surface mobility of postsynaptic AMPARs tunes synaptic transmission

Martin Heine et al. Science. .

Abstract

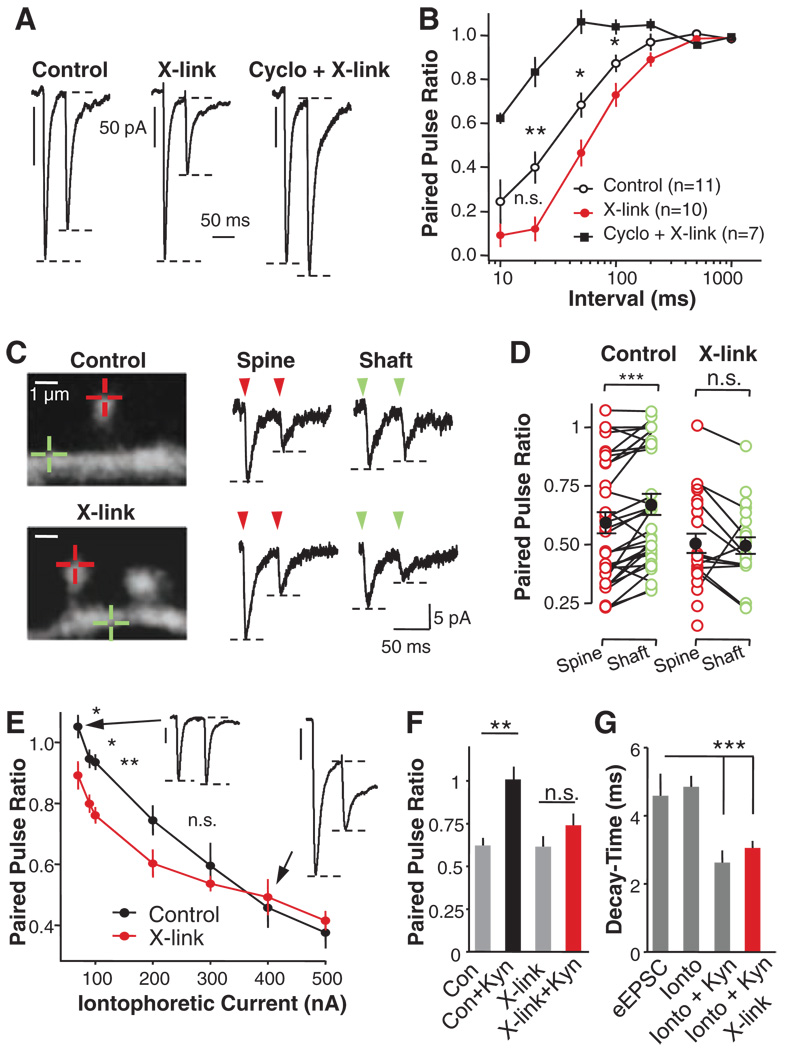
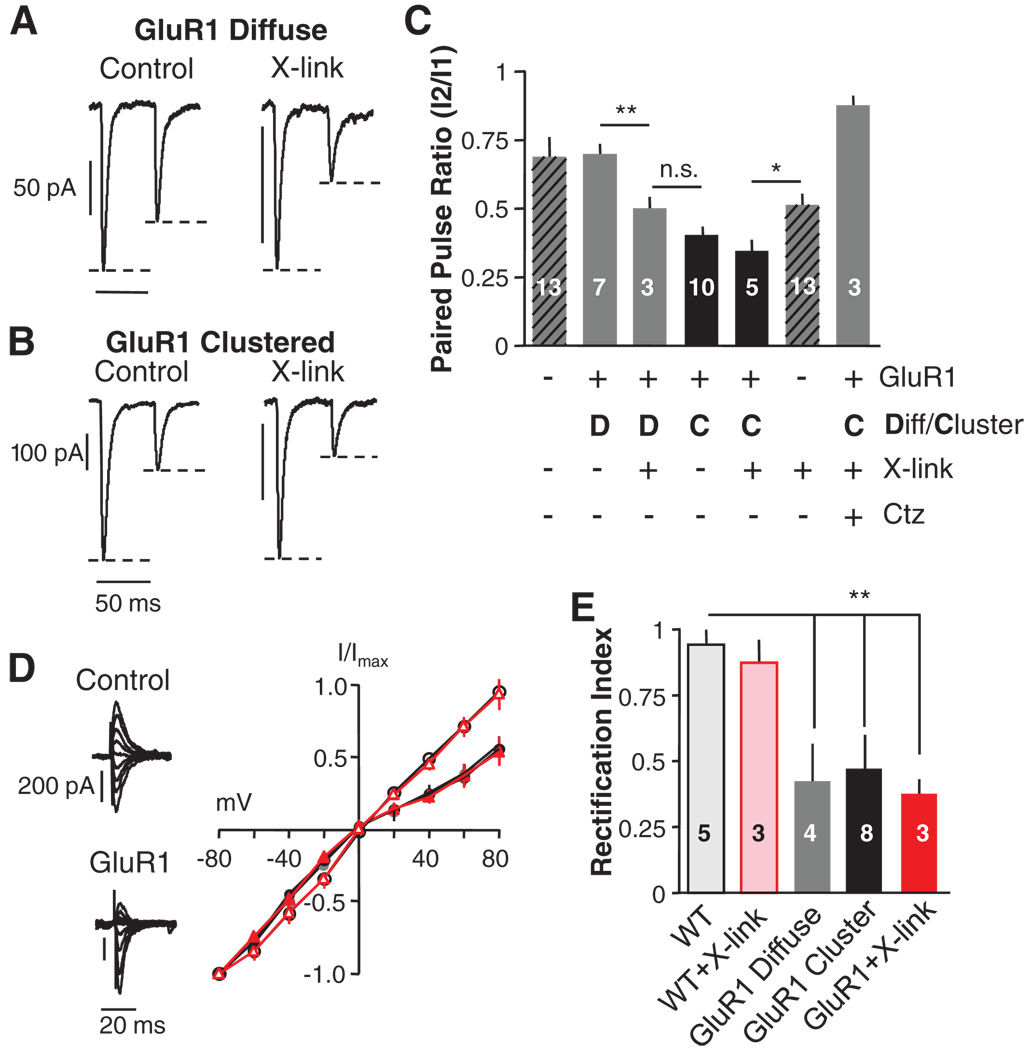
AMPA glutamate receptors (AMPARs) mediate fast excitatory synaptic transmission. Upon fast consecutive synaptic stimulation, transmission can be depressed. Recuperation from fast synaptic depression has been attributed solely to recovery of transmitter release and/or AMPAR desensitization. We show that AMPAR lateral diffusion, observed in both intact hippocampi and cultured neurons, allows fast exchange of desensitized receptors with naïve functional ones within or near the postsynaptic density. Recovery from depression in the tens of millisecond time range can be explained in part by this fast receptor exchange. Preventing AMPAR surface movements through cross-linking, endogenous clustering, or calcium rise all slow recovery from depression. Physiological regulation of postsynaptic receptor mobility affects the fidelity of synaptic transmission by shaping the frequency dependence of synaptic responses.


Figures

Fig. 1
Fig. 1
AMPAR immobilization increases PPD and decreases variability. (A) Sample whole-cell recordings of a connected pair of cultured hippocampal neurons. The pre-synaptic neuron was recorded in current-clamp at 0 pA and the postsynaptic neuron voltage-clamped at −60 mV. A pair of depolarizing pulses in the presynaptic cell separated by 50 ms triggered action potentials that each elicited an AMPAR-mediated EPSC in the postsynaptic neuron. (B) Series of evoked EPSCs elicited at 10-s intervals in control conditions or at least 10 min after X-link surface GluR2-containing AMPARs with an antibody to GluR2 followed by a secondary antibody to immunoglobulin G (IgG). (C) Plot of the coefficient of variation of EPSCs recorded as in (B) in 24 cells. GluR2 X-link decreases variability. P < 0.05. (D and E) Paired-pulse traces of EPSCs recorded as in (A) in control conditions or at least 10 min after X-link surface GluR2. These are different cells from the same culture batch.
Fig. 2
Fig. 2
Mobility of AMPARs in synapses form brain slices and cultured neurons. (A) Imaging of GluR2::pHGFP in live CA pyramidal neurons from hippocampal slices. Fluorescence was photobleached (t0) in spine (circles, red open arrow) and dendritic shaft (circles, green filled arrow). (B) Fluorescence recovery versus time in the photobleached areas in (A). (C) Averaged recovered fraction of GluR2::pHGFP in dendritic shaft (n = 41) or spine (n = 19) in hippocampal slices and 21 days in vitro (DIV) cultured hippocampal neurons expressing GluR2::pHGFP (n = 28) or GluR1::pHGFP (n = 40). (D) Trajectories of GluR1-containing AMPARs on dendrites of a 21-DIV cultured Homer1C::DsRed transfected hippocampal neuron. (Top) Diagram of AMPARs labeling with a QD through GluR1 antibody. (Bottom left) Imaged dendritic segment. Postsynaptic sites accumulate DsRed (arrows). Extrasynaptic (yellow) and synaptic (red) trajectories of QD-labeled GluR1 receptors recorded for 66 s are plotted. (Right) Trajectories on Homer1C::DsRed labeled postsynaptic sites for the three categories of observed diffusion behaviors within the synapse. (E) Histogram distribution of the instantaneous diffusion coefficients of synaptic trajectories obtained from GluR1-coupled QDs or Cy3 single dye molecule (SM). Dotted line is the threshold below which receptors are counted as immobile. (F) Frequency distribution of the displacement (Δt = 10 ms) of mobile GluR1 receptors within the synapse (median = 0.14 nm ± interquartile range (IQR) 0.08/0.19 nm). (G) Histogram of the mean ± SEM dwell time of GluR1 receptors in synapses, sorted by their diffusion properties (n = 10). For immobile receptors, only those transiently stabilized in the synapse are counted. P < 0.05.
Fig. 3
Fig. 3
AMPAR immobilization impedes recovery from depression during paired-pulse application of glutamate. (A) Whole-cell recordings of currents elicited by paired iontophoretic applications of glutamate to synaptic sites in control neurons (left), after X-link surface GluR2-containing AMPARs without (middle) or with (right) 50 µM cyclothiazide. Pulse interval is 50 ms; traces are averaged from 10 recordings. (B) Plot of the recovery rate as a function of interpulse interval; control (n = 11), X-link GluR2 (n = 15), with 50 µM cyclothiazide (n = 10). (C) (Left) Confocal images of individual spines and surrounding shaft area used to induce successive (50 ms apart) 2P-EPSCs in control (top) or after X-link of GluR1 (bottom). Uncaging spots were positioned (crosses) either at the spine tip (red) or on shaft (green). (Right) Current traces, uncaging at arrows. (D) Scattered plots of PPRs of 2P-EPSCs induced at spines or shaft regions in control conditions (n = 33 spines and shafts) and after X-link of GluR1 (n = 28 spines; shaft n = 22). Mean ± SEM is indicated by the black dots, and pairs of closely positioned spines and shafts are indicated by the connected lines (***P < 0.01). (E) Plot of the PPR versus applied iontophoretic current amplitude; control (n = 13), X-link (n = 8). (Insets) Sample traces for paired iontophoretic glutamate application (left, 90 nA/1 ms; right, 400 nA/1 ms). Scale bar, 50 pA (left), 100 pA (right). (F) Mean ± SEM of PPR for paired iontophoretic glutamate application (200 nA/1 ms) in control or after X-link of GluR2, without (Con) or with 1 mM kynurenic acid (Kyn) under the indicated conditions. n = 5 for each condition. (G) Mean ± SEM decay time constant of EPSCs, of currents evoked by iontophoretic glutamate application (200 nA/1 ms) in control (ionto), with 1 mM kynurenic acid (Kyn) before or after X-link of GluR2 (kyn + X-link).
Fig. 4
Fig. 4
Endogenous clustering of AMPARs increases PPD. (A and B) Sample whole-cell recordings of currents elicited by paired iontophoretic applications of glutamate to synaptic sites displaying diffuse (A) or clustered (B) GluR1 distribution in control neurons (left) or after X-link surface pHGFP::GluR1 by antibody to GFP (right). (C) Histograms of mean PPR ± SEM in the conditions exemplified in (A) and (B) and in controls. Measurements from recordings at Homer::DsRed synaptic sites in neurons expressing (GluR1+) or not (GluR1−) pHGFP::GluR1, with or without antibody to GFP–mediated X-link. Synaptic sites were sorted as bearing either a diffuse (D) or clustered (C) pHGFP::GluR1 distribution. One series of experiments is in the presence of cyclothiazide (Ctz). (D) (Left) Whole-cell currents elicited by iontophoretic applications of glutamate to synaptic sites recorded at various holding potentials in nontransfected (control) and pHGFP::GluR1 (GluR1)–expressing neurons. (Right) Plots of mean I-V curves for currents in the left. The curve is linear for control cells (empty circles), whereas it rectifies in pHGFP::GluR1-expressing neurons, at similar levels whether clustered (filled black circles) or diffuse (filled gray circles), indicating the higher proportion of GluR1 homomeric AMPARs. X-link either endogenous receptors with an antibody to GluR2 (empty triangles) or pHGFP::GluR1 with an antibody to GFP (filled triangles) does not modify the rectification index as compared to its matched control. (E) Mean + SEM of the rectification index in the indicated conditions.
Fig. 5
Fig. 5
Activity-dependent increase in intracellular calcium immobilize AMPARs and increase PPD. (A) (Left) Images of the cumulative surface explored (red) on dendrites by QDs bound to GluR1-containing AMPARs within 1 min of observation before, during, and 5 min after 50-Hz field stimulation (synapses in green). (Right) Summary plot of the evolution of the explored surface between the control recording period and 5 min after stimulation (n = 16). (B and C) Plots of the median of instantaneous diffusion coefficient versus time (B) or at 800 s (median ± IQR) of recording (C) for extrasynaptic (left) and synaptic (right) receptors. Both outside and inside synapses, stimulation at 5 Hz (blue squares) slightly increased receptor diffusion in comparison to the independent control (black circles), whereas 50-Hz stimulation (red circles) strongly decreased receptor mobility. Diffusion coefficient of N-cam (open red circles) was not changed after 50 Hz stimulation. (D) Plots of the mean fraction of GluR1 receptors that exchange between synaptic and extrasynaptic sites, with or without (2R)-amino-5-phosphonovaleric acid (APV), and before or at the indicated times after 50-Hz stimulation (n = 13). (E) (Left) Sample whole-cell currents elicited by paired iontophoretic applications of glutamate to synaptic sites before (top) and 5 min after (bottom) 50-Hz stimulation in different cells from the same culture. (Right) Cumulative frequency plot of the paired-pulse ratio recorded before (black line, 13 cells) and after (red line, 13 cells) 50-Hz stimulation. P < 0.01, Kolmogorov-Smirnov test. (F) Schematic diagram of the involvement of mobile AMPARs in regulating PPD. When AMPARs are largely mobile (left), AMPARs activated (red) and then desensitized (black) by a first glutamate release are rapidly exchanged by functional ones (green), which are then available for activation by a sequential glutamate release. In contrast, when AMPARs are immobilized (right), desensitized receptors remain in place, decreasing the amount of functional receptors available for activation by a sequential pulse.

Comment in

  • Neuroscience. Refreshing connections.
    Silver RA, Kanichay RT. Silver RA, et al. Science. 2008 Apr 11;320(5873):183-4. doi: 10.1126/science.1157589. Science. 2008. PMID: 18403696 No abstract available.

References

    1. Fortune ES, Rose GJ. Trends Neurosci. 2001;24:381. - PubMed
    1. Zucker RS, Regehr WG. Annu. Rev. Physiol. 2002;64:355. - PubMed
    1. Adesnik H, Nicoll RA, England PM. Neuron. 2005;48:977. - PubMed
    1. Ashby MC, Maier SR, Nishimune A, Henley JM. J. Neurosci. 2006;26:7046. - PMC - PubMed
    1. Borgdorff AJ, Choquet D. Nature. 2002;417:649. - PubMed

Publication types

MeSH terms