. 2008 Apr 25;4(4):e1000051.
doi: 10.1371/journal.pcbi.1000051.

Evaluation of paired-end sequencing strategies for detection of genome rearrangements in cancer

Affiliations

Evaluation of paired-end sequencing strategies for detection of genome rearrangements in cancer

Ali Bashir et al. PLoS Comput Biol. .

Abstract

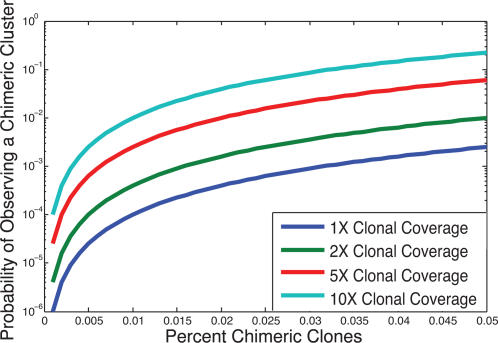
Paired-end sequencing is emerging as a key technique for assessing genome rearrangements and structural variation on a genome-wide scale. This technique is particularly useful for detecting copy-neutral rearrangements, such as inversions and translocations, which are common in cancer and can produce novel fusion genes. We address the question of how much sequencing is required to detect rearrangement breakpoints and to localize them precisely using both theoretical models and simulation. We derive a formula for the probability that a fusion gene exists in a cancer genome given a collection of paired-end sequences from this genome. We use this formula to compute fusion gene probabilities in several breast cancer samples, and we find that we are able to accurately predict fusion genes in these samples with a relatively small number of fragments of large size. We further demonstrate how the ability to detect fusion genes depends on the distribution of gene lengths, and we evaluate how different parameters of a sequencing strategy impact breakpoint detection, breakpoint localization, and fusion gene detection, even in the presence of errors that suggest false rearrangements. These results will be useful in calibrating future cancer sequencing efforts, particularly large-scale studies of many cancer genomes that are enabled by next-generation sequencing technologies.


Conflict of interest statement

The authors have declared that no competing interests exist.

Figures

Figure 1
Figure 1. Schematic of breakpoint calculation.
(A) The endpoints of a clone C from the cancer genome map to locations xC and yC (joined by an arc) on the reference genome that are inconsistent with C being a contiguous piece of the reference genome. This configuration indicates the presence of a breakpoint (a,b) that fuses at ζ in the cancer genome. (B) The coordinates (a,b) of the breakpoint are unknown but lie within the trapezoid described by Equation 1. The observed length of the clone is given by LC = (axC)+(byC). The rectangle U×V describes the breakpoints that lead to a fusion between genes U and V.
Figure 2
Figure 2. Prediction of a fusion between the NTNG1 and BCAS1 genes.
The rectangle indicates the possible locations of a breakpoint on chromosomes 1 and 20 that would result in a fusion between NTNG1 and BCAS1. Each trapezoid indicates possible locations for a breakpoint consistent with an invalid pair. Assuming that all clones contain the same breakpoint, this breakpoint must lie in the intersection of the trapezoids (shaded region). Approximately 69% of this shaded region intersects (darkly shaded region) the fusion gene rectangle, giving a probability of fusion of approximately 0.69. The empirical distribution of clone lengths reveals that not all clone lengths are equally likely (e.g. extremely long or short clones are rare). Using this additional information, our improved estimate for the probability of fusion is >0.99.
Figure 3
Figure 3. Fusion genes and gene lengths.
(A) Probability of fusion vs. the product of gene lengths involved in the fusion indicates higher fusion probabilities for pairs of larger genes. Larger circles indicate gene pairs experimentally validated by further sequencing. A “Positive Result” indicates a predicted fusion for which sequencing results supported a fusion gene. A “Negative Result” indicates a predicted fusion for which sequencing results did not support a fusion gene. (B) The number of fusion genes in chimerDB plotted as a function of the product of gene lengths in the fusion.
Figure 4
Figure 4. Schematic of a breakpoint region.
A fusion point ζ on the cancer genome contained in multiple clones. The leftmost and rightmost clones determine the breakpoint region Θζ in which the fusion point can occur.
Figure 5
Figure 5. Probability of localizing a fusion point to an interval of a given length.
A fusion point ζ is localized to length s if the corresponding breakpoint point region Θζ has length s or less. When s exceeds the clone length L, only a single clone is required to achieve this localization and consequently the probability of localization is the probability that at least one clone contains the fusion point. In the case of 1 M paired reads the 40 kb and 150 kb curves are nearly indistinguishable. Note that each curve is obtained using a fixed clone length, and that the use of a distribution of clone lengths would create a less abrupt transition.
Figure 6
Figure 6. Distribution of gene sizes for different groups of genes.
All genes: The “known genes” track in the UCSC Genome Browser . Kinases: Selected from the KinBase database . Transcription factors: Selected from the AmiGO database according to the GO term “transcription factor activity” . ChimerDB: Fusion genes in cancer extracted from the chimerDB database . Random Fusion Genes: A set of 2000 genes involved in 1000 random fusion events. Random Fusion events were formed by inducing random breakpoints, and selecting such events if they formed a fusion gene. Note that the gene sizes are on a log scale, and the number of genes from each set used to derive each distribution is shown in the legend.
Figure 7
Figure 7. The number of paired reads necessary to detect fusion genes.
(A) The number of paired reads necessary to detect fusion genes with fusion probability greater than 0.5 as a function of gene size for different clone lengths. The vertical lines indicate median (20 kb) and mean (40 kb) sizes for all known genes as well as the median (40 kb) and mean (90 kb) sizes for chimerDB genes. (B) The number of paired reads necessary to detect fusion genes with fusion probability greater than 0.5 as a function of clone length for different fusion genes sizes (log scale in both axes). Each point in these plots is the average over 100 different fusion genes and and 100 different simulations of clone sets from the genome. Thus, each data point represents the average value of 104 simulations. In each simulation, a pair of genes was chosen such that area of the resulting gene rectangle (U×V) was equal to the square of the indicated fusion gene size. A breakpoint was selected for the gene pair uniformly in the rectangle U×V).
Figure 8
Figure 8. Sensitivity and specificity of fusion gene predictions.
(A) Number of false positive (FP) and true positive (TP) fusion gene predictions for a simulated genome with 100 translocations and 10,000 paired reads. Each curve represents the average of 50 simulations with clones of a fixed length (2 kb, 40 kb, 150 kb clones). The minimum fusion probability threshold for indicating that a fusion gene was predicted was decreased from >.95 (leftmost point) to >0 (rightmost point) in increments 0.05 and the number of true and false predictions was determined. For all figures 19 true fusion genes were present in the rearranged genome. These 19 events were not selected for but rather they resulted from random rearrangement of the genome. (B) 100,000 paired reads. (C) 1,000,000 paired reads. (D) 10,000,000 paired reads.
Figure 9
Figure 9. Probability of observing at least one chimeric cluster vs. the percent of chimeric clones.
These probabilities were computed using Equation 27, with clone length L = 150 kb and confirmed by simulation. Other clone lengths yield virtually identical probabilities at the same clonal coverage. Note: the y-axis is log scaled.

References

    1. Morris SW, Kirstein MN, Valentine MB, Dittmer KG, Shapiro DN, et al. Fusion of a kinase gene, ALK, to a nucleolar protein gene, NPM, in non-Hodgkin's lymphoma. Science. 1994;263:1281–1284. - PubMed
    1. May WA, Gishizky ML, Lessnick SL, Lunsford LB, Lewis BC, et al. Ewing sarcoma 11;22 translocation produces a chimeric transcription factor that rRequires the DNA-binding domain encoded by FLI1 for transformation. Proc Natl Acad Sci U S A. 1993;90:5752–5756. - PMC - PubMed
    1. Kurzrock R, Talpaz M. The molecular pathology of chronic myelogenous leukaemia. Br J Haematol. 1991;79:34–37. - PubMed
    1. Druker BJ. STI571 (Gleevec) as a paradigm for cancer therapy. Trends Mol Med. 2002;8:S14–S18. - PubMed
    1. Mitelman F, Johansson B, Mertens F. Fusion genes and rearranged genes as a linear function of chromosome aberrations in cancer. Nat Genet. 2004;36:331–334. - PubMed

Publication types