. 2008 May 9;4(4):e1000058.
doi: 10.1371/journal.pcbi.1000058.

Estimating cell depth from somatic mutations

Affiliations

Estimating cell depth from somatic mutations

Adam Wasserstrom et al. PLoS Comput Biol. .

Abstract

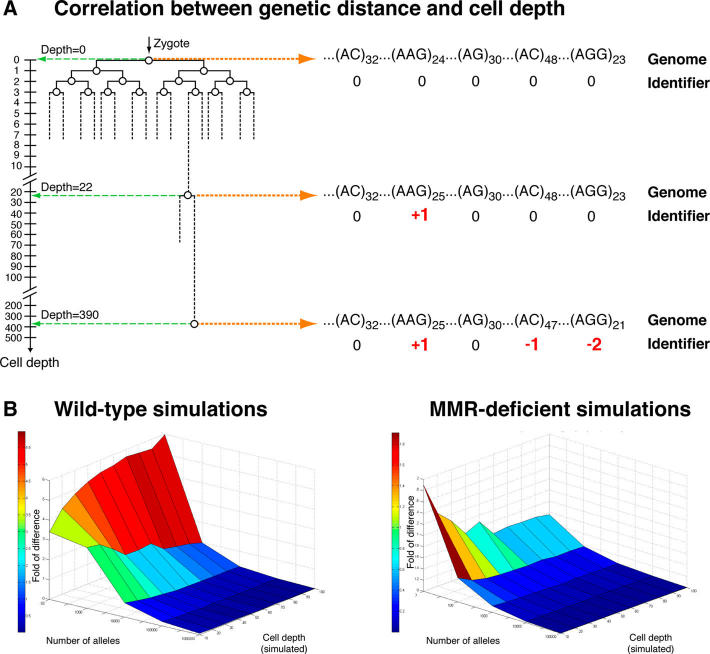
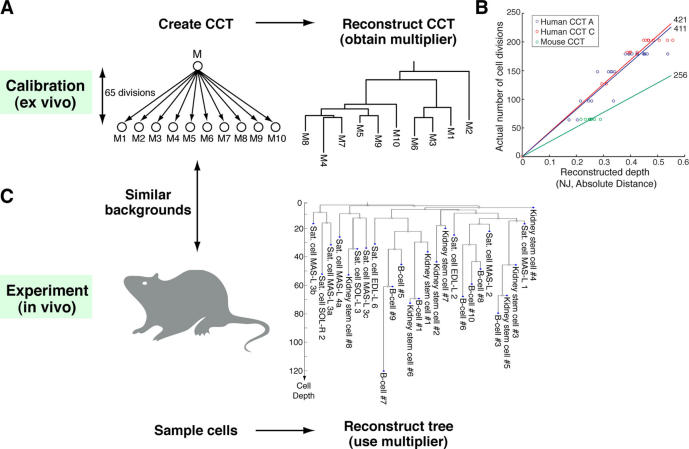
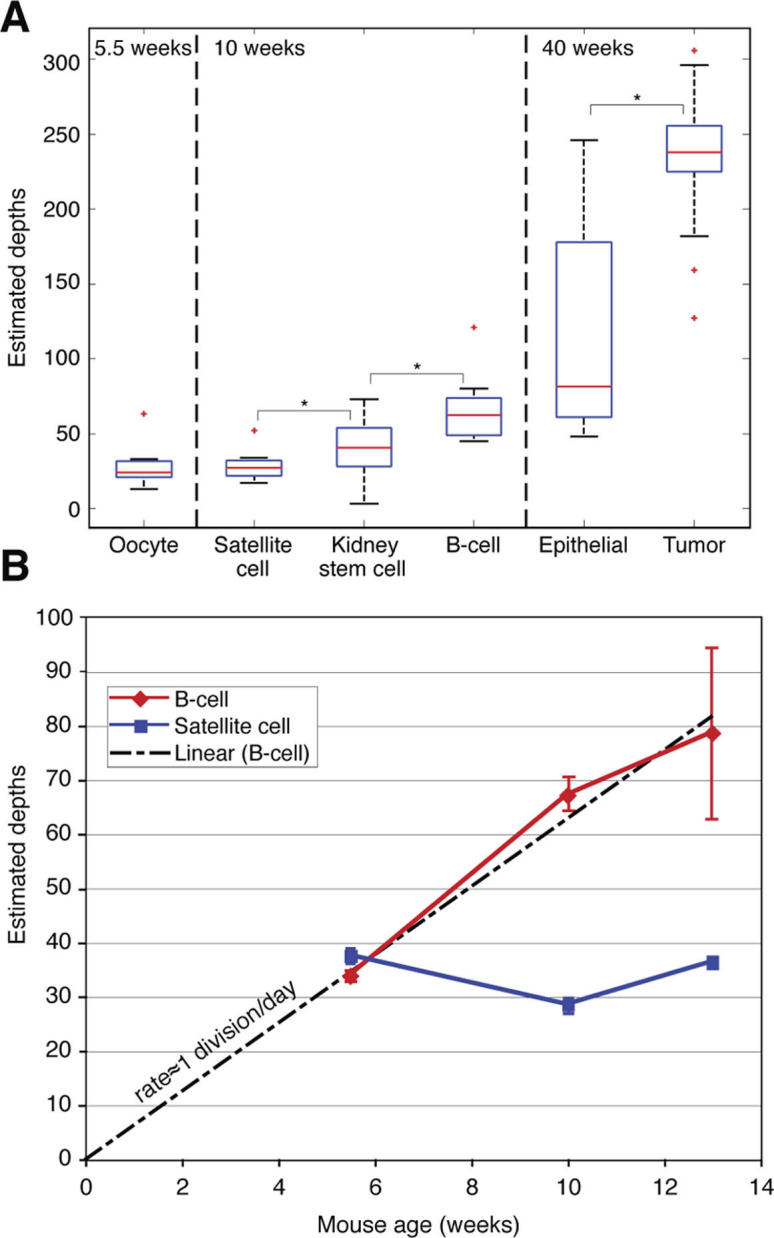
The depth of a cell of a multicellular organism is the number of cell divisions it underwent since the zygote, and knowing this basic cell property would help address fundamental problems in several areas of biology. At present, the depths of the vast majority of human and mouse cell types are unknown. Here, we show a method for estimating the depth of a cell by analyzing somatic mutations in its microsatellites, and provide to our knowledge for the first time reliable depth estimates for several cells types in mice. According to our estimates, the average depth of oocytes is 29, consistent with previous estimates. The average depth of B cells ranges from 34 to 79, linearly related to the mouse age, suggesting a rate of one cell division per day. In contrast, various types of adult stem cells underwent on average fewer cell divisions, supporting the notion that adult stem cells are relatively quiescent. Our method for depth estimation opens a window for revealing tissue turnover rates in animals, including humans, which has important implications for our knowledge of the body under physiological and pathological conditions.


Conflict of interest statement

The authors have declared that no competing interests exist.

Figures

Figure 1
Figure 1. Cell depth analysis.
(A) The depth of a cell is the number of divisions it underwent since the zygote. The figure shows a tiny part of the cell lineage tree of an organism – a binary tree representing the exact pattern of cell divisions of its developmental history from a single cell to its current state. The tree depicts not only the lineage relations between cells, but also their depths, obtained by projecting them to the depth axis. A correlation between genetic distance and cell depth is shown in a small fraction (5 MS alleles) of the genome. Each allele is assigned a relative allelic value – a whole number equal to the difference between the number of repeats of that allele and the number of repeat units of the corresponding allele in the zygote. Mutations are coloured in red. (B) Computer simulations of MS mutations and depth estimations based on a maximum likelihood approach. Cells at various depths were simulated accumulating MS stepwise mutations according to wild-type and MMR-deficient mutation rates (p = 2.5*10−5 and p = 0.01, respectively). Depth estimation errors were scored according to the log (base 2) of the ratio between the estimated and simulated depths.
Figure 2
Figure 2. Estimating cell depths from somatic mutations.
(A) Our method for in vivo cell depth estimation employs a calibration system based on a cultured cell tree (CCT) – an ex vivo tree with known topology and well-estimated edge lengths. A CCT created from an Mlh1−/− mouse cell line (of similar background to the mice in which we performed depth analyses) is shown. CCT leaves (M1–M10) were analyzed over a panel of about 100 MS loci, and a tree was reconstructed using the method described in ref. (Neighbor-Joining [NJ] phylogenetic algorithm and ‘Absolute-distance’ distance function were used; see Materials and Methods). Reconstructed depths of all leaves (except for M2, an outlier omitted from analysis) were very similar, with a standard deviation of less than 8% of the mean. (B) Linear correlation between actual and reconstructed depths of human and mouse CCTs. Circles represent CCT nodes; numbers indicate multipliers in each CCT. (C) A multiplier obtained from a CCT is used to calibrate the depths of cells in the reconstructed cell lineage tree.
Figure 3
Figure 3. In vivo depth estimations.
Depth estimates of various cells sampled from mice aged 5.5–40 weeks. (A) Box plots of depths according to cell type and mouse age. Box (blue) displays the middle 50% of the data from the lower to upper quartiles (median is red). Ends of vertical lines (whiskers) indicate minimum and maximum data values, unless outliers (marked by ‘+’) are present, in which case the whiskers extend to a maximum of 1.5 times the inter-quartile range. Stars depict cell types with statistically significant different average depths (p<0.05). (B) Average depths of satellite cells and B cells as a function of mouse age. While depths of satellite cells did not correlate to age, depths of B cells showed a linear correlation (R2 = 0.97) to age, corresponding to about one cell division per day. Error bars denote standard errors of the mean.

References

    1. Sulston JE, Schierenberg E, White JG, Thomson JN. The embryonic cell lineage of the nematode Caenorhabditis elegans. Dev Biol. 1983;100:64–119. - PubMed
    1. Salipante SJ, Horwitz MS. A phylogenetic approach to mapping cell fate. Curr Top Dev Biol. 2007;79:157–184. - PubMed
    1. Vogel F MA. Human genetics. Berlin: Springer-Verlag; 1996.
    1. Drost JB, Lee WR. Biological basis of germline mutation: comparisons of spontaneous germline mutation rates among drosophila, mouse, and human. Environ Mol Mutagen. 1995;25:48–64. - PubMed
    1. Bromham L, Penny D. The modern molecular clock. Nat Rev Genet. 2003;4:216–224. - PubMed

Publication types