. 2008 Apr 11;4(4):e1000049.
doi: 10.1371/journal.pgen.1000049.

Cell-to-cell stochastic variation in gene expression is a complex genetic trait

Affiliations

Cell-to-cell stochastic variation in gene expression is a complex genetic trait

Juliet Ansel et al. PLoS Genet. .

Abstract

The genetic control of common traits is rarely deterministic, with many genes contributing only to the chance of developing a given phenotype. This incomplete penetrance is poorly understood and is usually attributed to interactions between genes or interactions between genes and environmental conditions. Because many traits such as cancer can emerge from rare events happening in one or very few cells, we speculate an alternative and complementary possibility where some genotypes could facilitate these events by increasing stochastic cell-to-cell variations (or 'noise'). As a very first step towards investigating this possibility, we studied how natural genetic variation influences the level of noise in the expression of a single gene using the yeast S. cerevisiae as a model system. Reproducible differences in noise were observed between divergent genetic backgrounds. We found that noise was highly heritable and placed under a complex genetic control. Scanning the genome, we mapped three Quantitative Trait Loci (QTL) of noise, one locus being explained by an increase in noise when transcriptional elongation was impaired. Our results suggest that the level of stochasticity in particular molecular regulations may differ between multicellular individuals depending on their genotypic background. The complex genetic architecture of noise buffering couples genetic to non-genetic robustness and provides a molecular basis to the probabilistic nature of complex traits.


Conflict of interest statement

The authors have declared that no competing interests exist.

Figures

Figure 1
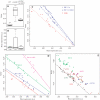
Figure 1. Strain-to-strain variation and complex genetic segregation of noise.
A) Five representative flow-cytometry experiments on strains GY51, GY43, GY44, GY53 and GY445 derived from S288c, FL200, CEN.PK, RM11-1a and Y9J_1 respectively, each showing the distribution of PMET17-GFP expression levels in 15,000 individual cells (events) after two hours of moderate induction. Raw fluorescent values were corrected for cell size and granularity as described in Materials and Methods. Mean expression levels were similar between strains, while variances differed. B) Boxplot representation of flow-cytometry experiments repeated n times in the same conditions as in A), showing reproducible noise differences between genetic backgrounds. C–D) Genetic segregation of PMET17-GFP noise in a cross between S288c and RM11-1a backgrounds. Colored dots in C) represent independent flow-cytometry experiments performed on strain GY51 (red) or strain GY53 (blue). Each open circle represents the average values of three experiments performed on one S288c×RM11-1a segregant. The distribution of noise values in these segregants is shown in D), with the average noise of GY51 and GY53 represented as red and blue crosses, respectively. The arrow points to segregant GY157 displaying extremely high noise. E–F) Genetic segregation of PMET17-GFP noise in a cross between FL200 and CEN.PK backgrounds. Representation is similar as in C) and D), with repeated experiments on strain GY43 and GY44 shown in green and magenta, respectively. One flow-cytometry experiment was performed on each segregant obtained by crossing GY43 and GY44 (open circles). All segregants analyzed possessed the ura3-52 mutation of GY44, and their differences must therefore result from allelic variations residing in other genes.
Figure 2
Figure 2. Genome scans for noise QTL.
A) Noise levels of PMET17-GFP from S288c×RM11-1a segregants were treated as a quantitative phenotype and genetic linkage was tested at each of 3042 marker positions on the genome. Markers were ordered by their physical position on the reference genome S288c, from chromosome I to chromosome XVI. At every marker, the y-axis represents the -log10(P) linkage score, where P is the nominal P-value of the test. The dashed line indicates the 1% genome-wide significance threshold. Two significant signals (QTL1 and QTL2) were found on chromosome III and XIV, respectively. B) Cumulative genotypes of two introgressed strains. Haploid strains GY159 and GY174 were constructed by introgressing high PMET17-GFP noise level from RM11-1a into S288c. These strains were genotyped at 3015 marker positions using oligonucleotide microarrays. Markers were ordered along the x-axis as in a) and are shown as small dots. The GY159 and GY174 genotypes are presented on three levels depending on whether both strains (bottom), one of them (middle), or no strain (top) inherited the RM11-1a allele of the marker. Among the bottom genotypes, markers that where also inherited from RM11-1a in strain GY157 (the S288c×RM11-1a segregant with highest noise) are marked by crosses. These positions are candidates to contain RM11-1a alleles conferring high noise. A cluster of such candidate markers was found on chromosome V (arrow).
Figure 3
Figure 3. Contributions of QTL to PMET17-GFP noise (top panels) and mean expression (bottom panels).
A–B) S288c×RM11-1a segregants were separated in two groups (F1-BY and F1-RM) according to their genotype at QTL1 (A) or QTL2 (B). For both QTL, the inheritance of the RM11-1a allele was associated to lower noise and higher mean expression. The differences in mean expression between the F1-RM and F1-BY groups were highly significant: P = 4×10⁻⁶ (A) and P = 7.8×10⁻⁹ (B). C) Strain GY157 was crossed with a derivative of S288c, and fifty five segregants were characterized. These segregants were separated in two groups (B2-BY and B2-RM) according to their genotype at the candidate region on chromosome V. The RM11-1a allele conferred a significant increase in noise (P = 3.5×10⁻³), therefore validating the region as a third QTL (QTL3), while no effect of the genotype was observed on mean expression.
Figure 4
Figure 4. Increased noise resulting from transcriptional elongation impairment.
A–B) Comparison of PMET17-GFP noise and mean expression levels between S288c-derived strains GY244, GY246 and GY333 that were isogenic except for the specified ura3 genotypes. C) Complementation of ura3 in RM11-1a derived strain partially reduced its high-noise phenotype. Strains GY51 (open red circles), GY53 (filled blue triangles) and GY601 (open blue triangles) were compared at various induction strength (Methionine concentration from 0 to 200 µM). Each dot represents one sample of 15,000 cells. Lines indicate linear fits on each strain. D) Additive noise increase in response to 6-azauracil (6AU) and TFIIS (dst1) mutation. Wild-type strain GY51 (circles) and dst1Δ strain GY321 (triangles) were cultured with (filled blue, filled magenta) or without (open red, open green) 6AU, at various induction strength as in c). Lines indicate linear fits on each subgroup. E) Comparison of PMET17-GFP noise and mean expression levels between various transcription elongation mutants. Strains GY602 (control strain trp1Δ::KanMX, black ‘x’), GY321 (dst1Δ::hisG, open green triangles), GY358 (dst1Δ::hisG hoΔ::KanMX, filled green triangles), GY361 (dst1Δ::hisG hoΔ::(DST1+KanMX), filled black squares), GY603 (eaf3Δ::KanMX, brown ‘+’); GY604 (spt4Δ::KanMX, purple filled circles), GY605 (leo1Δ::KanMX, orange filled diamonds), GY606 (set2Δ::KanMX, open red circles), GY607 (ccr4Δ::KanMX, filled dark green squares), GY608 (cdc73Δ::KanMX, blue stars), that were all isogenic to GY51 except for the specified genotypes were compared at various induction strength. Dashed line represents linear fit to the GY602 control strain data points (no elongation impairment).

References

    1. Damerval C, Maurice A, Josse JM, de Vienne D. Quantitative trait loci underlying gene product variation: a novel perspective for analyzing regulation of genome expression. Genetics. 1994;137:289–301. - PMC - PubMed
    1. Brem RB, Yvert G, Clinton R, Kruglyak L. Genetic dissection of transcriptional regulation in budding yeast. Science. 2002;296:752–755. - PubMed
    1. Klose J, Nock C, Herrmann M, Stuhler K, Marcus K, et al. Genetic analysis of the mouse brain proteome. Nat Genet. 2002;30:385–393. - PubMed
    1. Li Y, Alvarez OA, Gutteling EW, Tijsterman M, Fu J, et al. Mapping determinants of gene expression plasticity by genetical genomics in C. elegans. PLoS Genet. 2006;2:e222. - PMC - PubMed
    1. DeCook R, Lall S, Nettleton D, Howell SH. Genetic regulation of gene expression during shoot development in Arabidopsis. Genetics. 2006;172:1155–1164. - PMC - PubMed

Publication types