. 2008 Apr 11;4(4):e1000050.
doi: 10.1371/journal.pgen.1000050.

Bmp4 is essential for the formation of the vestibular apparatus that detects angular head movements

Affiliations

Bmp4 is essential for the formation of the vestibular apparatus that detects angular head movements

Weise Chang et al. PLoS Genet. .

Abstract

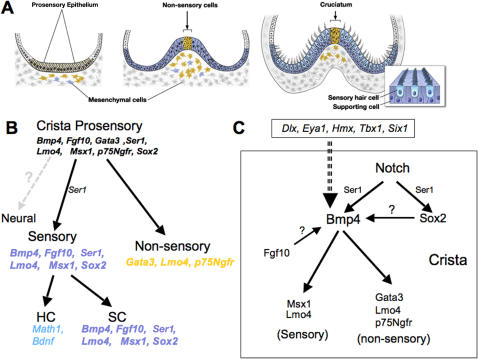
Angular head movements in vertebrates are detected by the three semicircular canals of the inner ear and their associated sensory tissues, the cristae. Bone morphogenetic protein 4 (Bmp4), a member of the Transforming growth factor family (TGF-beta), is conservatively expressed in the developing cristae in several species, including zebrafish, frog, chicken, and mouse. Using mouse models in which Bmp4 is conditionally deleted within the inner ear, as well as chicken models in which Bmp signaling is knocked down specifically in the cristae, we show that Bmp4 is essential for the formation of all three cristae and their associated canals. Our results indicate that Bmp4 does not mediate the formation of sensory hair and supporting cells within the cristae by directly regulating genes required for prosensory development in the inner ear such as Serrate1 (Jagged1 in mouse), Fgf10, and Sox2. Instead, Bmp4 most likely mediates crista formation by regulating Lmo4 and Msx1 in the sensory region and Gata3, p75Ngfr, and Lmo4 in the non-sensory region of the crista, the septum cruciatum. In the canals, Bmp2 and Dlx5 are regulated by Bmp4, either directly or indirectly. Mechanisms involved in the formation of sensory organs of the vertebrate inner ear are thought to be analogous to those regulating sensory bristle formation in Drosophila. Our results suggest that, in comparison to sensory bristles, crista formation within the inner ear requires an additional step of sensory and non-sensory fate specification.


Conflict of interest statement

The authors have declared that no competing interests exist.

Figures

Figure 1
Figure 1. Schematic representations of mouse inner ear development from 11.5 to 13 dpc.
(A)Upper panel shows schematic cross-sections through the prospective or definitive anterior and posterior canals at the level of the lines. Blue marks the three Bmp4-positive presumptive cristae, while red marks the other three sensory tissues-the maculae utriculi and sacculi, and the organ of Corti. An enlargement of a mature anterior crista at 15.5 dpc or later is shown. (B–I) Inner ear phenotypes of Bmp4 conditional null embryos. Wholemount in situ hybridization of Bmp4loxP/+ (B,D,F,H) and Foxg1cre/+; Bmp4loxP/Tm1 (B4cko, C,E,G,I) embryos at 10.5 dpc hybridized with Bmp4 RNA probe specific for exons 3 and 4 (B4-del). (B, C) Arrows point to the down-regulation of Bmp4 expression in the eyes and otocysts of Foxg1cre/+; Bmp4loxP/Tm1 (C), compared to Bmp4loxP/+ embryos (B). Arrowheads point to unaffected Bmp4 expression in limb buds and somites. (D) and (E) are higher magnifications of the otocysts shown in (B) and (C), respectively. Arrow and arrowhead in (D) point to Bmp4 hybridization signals in the anterior streak (encompassing anterior and lateral cristae) and the posterior crista of the otocyst, respectively. An arrow in (E) points to the residual Bmp4 expression in the anterior streak of Foxg1cre/+; Bmp4loxP/Tm1 embryos. (F–I) Higher magnifications of Bmp4 expression domains in the eyes (F, G) and hindbrain (H,I) in Bmp4loxP/+ (F, H) and Foxg1cre/+; Bmp4loxP/Tm1 (G, I) embryos. Arrows point to the reduction of Bmp4 expression, and the malformation of the eyes, whereas arrowheads point to the normal Bmp4 expression in the hindbrain. Scale bar in (C) applies to (B); scale bars in (D), (G) and (I) equal 100μm and apply to (E), (F), and (H), respectively. Abbrevations: aa, anterior ampulla; ac, anterior crista; asc, anterior semicircular canal; cc, common crus; cd, cochlear duct; ed, endolymphatic duct; fp, fusion plate; hp, horizontal canal pouch; la, lateral ampulla; lc, lateral crista; lsc, lateral semicircular canal; oc, organ of Corti; pa, posterior ampulla; pc, posterior crista; psc, posterior semicircular canal; rd, resorption domain; s, saccule; u, utricle; vp, vertical canal pouch.
Figure 2
Figure 2. Inner ear analyses of Bmp4 conditional null embryos.
Paint-filled inner ears of control Bmp4loxP/+ (A,G), Foxg1cre/+; Bmp4loxP/Tm1 (B–D,H) and TgPax2cre; Bmp4loxP/Tm1 (E,F) embryos at 11.5 (G,H) and 13.5 dpc (A–F). Inserts in (A)–(F) are ventral views of the cochlear duct. The most malformed inner ears of Foxg1cre/+; Bmp4loxP/Tm1 embryos are shown in (B) and (C), compared to controls (A). In (D), the inner ear is normal except for truncation of the lateral canal (arrows). A mildly (E) and more severely (F) affected inner ear of TgPax2cre; Bmp4loxP/Tm1 embryos. Inner ears of Bmp4loxP/+ (G) and (H) Foxg1cre/+; Bmp4loxP/Tm1 embryos at 11.5 dpc. Arrow in (H) points to the smaller canal pouch in Foxg1cre/+; Bmp4loxP/Tm1 embryos. Orientations in (G) apply to all panels. Scale bars in (F) and (H) apply to (A–E) and (G), respectively.
Figure 3
Figure 3. Gene expression analyses of Foxg1cre/+; Bmp4loxP/Tm inner ears at 11.5 dpc.
(A–A') Adjacent sections of a Bmp4loxP/+ control showing the Bmp4-positive lateral crista region (A, lc), which is also positive for Gata3 (A') and Msx1 (A”). (B,B',B”) Adjacent sections of a Foxg1cre/+; Bmp4loxP/Tm1 (B4cko) embryo showing the lack of crista-associated expression of Bmp4 (B), Gata3 (B') and Msx1 (B”). (C) A schematic diagram showing the expression domains of Bmp2 and Bmp4 in the canal pouch at 11.5 dpc, and the approximate level of section for each panel. (D–G) Wholemount (D,E) and section (F,G) in situ hybridization showing the reduction of Bmp2 expression in the canal pouch (outlined in D, E) of Foxg1cre/+; Bmp4loxP/Tm1 (E,G), compared to Bmp4loxP/+ (D,F) inner ears. (F) Bmp2 expression is associated with the prospective posterior and lateral canals (vp and hp) in Bmp4loxP/+ embryos but only in the anterior region of the canal pouch in Foxg1cre/+; Bmp4loxP/Tm1 embryos (G, arrow) where residual Bmp4 expression is sometimes present. (H–I') Dlx5 (H, I) and Hmx3 (H',I') expression domains in the canal pouch of Bmp4loxP/+ (H,H') and Foxg1cre/+; Bmp4loxP/Tm1 (I,I') embryos. The endolymphatic duct (ed) is Dlx5-positive (H,I) and Hmx3-negative (H',I'). Canal pouches of Foxg1cre/+; Bmp4loxP/Tm1 inner ears are Dlx5 negative (I) and Hmx3 positive (I'). Orientations: A, anterior; L, lateral. Orientations in (I') apply to all panels except (D) and (E). Scale bars = 100 μm. Scale bar in (F) applies to (A–B) and (G); scale bars in (E) and (I) apply to (D) and (H–I'), respectively.
Figure 4
Figure 4. Expression patterns of crista-associated genes during differentiation.
Sections of developing chicken cristae at E3.5 (A,B), E5.5 (C,D) and E10 (E–G). (A, A') Adjacent sections showing the co-expression of Bmp4 (A) with Gata3 (A') and p75Ngfr (B) in the anterior crista region at E3.5. (C–C”) Adjacent sections showing expression patterns of p75Ngfr (C) and Gata3 (C') largely non-overlapping with the two Bmp4-positive regions (C”). Gata3 is also expressed in the mesenchymal region surrounding the crista. (D) Ser1 expression pattern in the developing crista is similar to that of Bmp4 (C”), in two separate domains (double arrows), whereas (D') Lmo4 is expressed in the Ser1-positive regions (pc, double arrows) as well as in the area between the two Ser1-positive regions (arrow). (E–F) Cross- and (G) sagittal-sections of the developing crista at E10. (E”) Bmp4, (F) Sox2, (F') Fgf10, and (G') Msx1 are expressed in the sensory region of the developing crista, whereas (E) p75Ngfr and (E') Gata3 are expressed in the non-sensory, cruciatum region in the center of the crista. Inserts (i) and (ii) in (E”) are higher magnifications of a sensory region in (E”) showing the Bmp4 expression domain spanning the entire epithelium and the Bdnf domain only located apically in the sensory hair cells, respectively. The dotted line in insert (ii) marks the base of the sensory epithelium. The expression domain of p75Ngfr appears to surround the Gata3-positive region in the cruciatum (E, E'; G, G”). Moreover, both Gata3 and p75Ngfr are expressed in the transitional zone of the developing crista (G, G”; arrowheads). The p75Ngfr expression in the transitional zone is already apparent at E5.5 (Figure 4C, arrowheads). (G”’) Lmo4 is expressed in both the sensory (small arrows) and cruciatum (arrow) region of the developing crista. Orientations in (C) apply to (A–D'). (E–F') and (G'–G”’) are cross- and sagittal-sections of the anterior crista at E10, respectively. Scale bars = 100 μm. Scale bars in (D'), (F') and (G”’) apply to (A–D), (E–F) and (G–G”), respectively.
Figure 5
Figure 5. Ectopic expession of Smad6 down-regulates crista-associated genes in chicken inner ears.
(A–C) Whole mount embryos at E4 showing GFP expression in the targeted anterior crista region 14 hrs after electroporation with pSmad6 (A) or pGfp (B) plasmids. (C) Bmp4 expression in the cristae. (D–G”) Sections of inner ears electroporated with pSmad6 (D,F) or pGfp (E,G) plasmids at E3.5 and harvested 14 hrs after electroporation. (D–D”) Adjacent sections probed for Gfp (D), Gata3 (D') and Sox2 (D”) transcripts. Within the electroporated anterior crista region (D), Gata3 expression is down-regulated (D', arrows), whereas Sox2 expression is unaffected (D”). (F–F”) Down-regulation of p75Ngfr (F') in the electroporated region (F), but expression of Fgf10 is not affected (F”, arrows). None of these gene expression patterns are affected in controls electroporated with pGfp (E, G). Inserts in (F') and (G') are higher magnifications of the anterior crista. Scale bars in (B) and (C) equal 1 mm and scale bar in (B) applies to (A). Scale bar in (G”) equals 100 μm and applies to (D–G').
Figure 6
Figure 6. Ectopic expression of Noggin down-regulates crista-associated genes in chicken inner ears.
Inner ears were electroporated with pNoggin (A,C,E) and pIRES-Gfp (B,D,F) at E3.5 and harvested 14 hrs later. (A–A”) Adjacent sections probed for Gfp (A), Msx1 (A'), and Bmp4 (A”) transcripts. Msx1 (A') expression is abolished in the electoporated (A), Bmp4-positive anterior crista region (A”, ac), whereas Bmp4 expression is not affected (A”). Msx1 expression is reduced in the mesenchymal region (A', arrowheads). (C–C”) Adjacent sections showing the absence of Lmo4 (C') in the electroporated (C), Sox2-positive anterior crista region (C”, arrows). (E–E”) Adjacent sections probed for Gfp (E), Gata3 (E'), and Ser1 (E”) transcripts. (E') Gata3 expression is down-regulated in the anterior crista (arrows) as well as the surrounding mesenchyme (arrowheads), but Ser1 expression is not changed (E”). (B,D,F) None of these gene expression patterns are affected in specimens electroporated with the pIRES-Gfp. Abbreviations: cvg, cochleovestibular ganglion. Scale bar in (F”) equals 100 μm and applies to all panels.
Figure 7
Figure 7. Down-regulation of phosphosmad1, Msx1 and Gata3 immunoreactivities following pSmad6 and pNoggin electroporations.
Sections of inner ears electroporated with pSmad6 (A,C,E,G), pGfp (B, D, F), pNoggin (H), and pIRES-Gfp (I) at E3.5 and harvested 14 hrs later. (A, A') A section stained with anti-phosphosmad1 (PS1, red), anti-GFP (green), and anti-neurofilament (blue) antibodies. Cells electroporated with pSmad6 (outlined) are GFP-positive (A) and PS1-negative (A'). The neurofilament staining identifies the presumptive crista region. (B, B') A section from an inner ear electroporated with pGfp showing the GFP-positive cells (B) are also positive for PS1 staining (B'). (C-D) pSmad6-positive cells (C, arrowheads) are negative for anti-Msx staining, whereas GFP-control cells (D, arrowheads) are positive for Msx immunoreactivity (D'). (E–F') pSmad6-positive cells in (E) are negative for Gata3 (E'), but GFP-control cells (F) are Gata3 positive (F'). Arrows in (F) point to GFP-positive cells outside of the crista region. (G) pSmad6-positive cells are positive for Sox2 staining (arrowheads). (H, I) A pNoggin-treated section (H) showing the absence of Gata3 staining in both the epithelium (e) and mesenchyme (m), whereas Gata3 staining is normal in pIRES-Gfp treated specimen (I). Blue arrowheads point to cells that are GFP positive (data not shown).
Figure 8
Figure 8. pSmad6 and pNoggin-induced inner ear phenotypes.
Paint-filled inner ears at E7 after electroporation with pGfp (A, B), pSmad6 (C), or pNoggin (D) at E3.5. Inner ears electroporated with pGfp are either normal (A), or show non-resorption of the anterior canal (B, arrow) and absence of a distinct anterior ampulla (B, small arrow). (C) A pSmad6-treated inner ear showing a malformed anterior ampulla (small arrow) and absence of the anterior canal. The common crus is wider than normal (arrow). (D) A pNoggin-treated inner ear showing the absence of the three ampullae, anterior and lateral canals. The posterior fusion plate is not resorbed (arrow). (E–G) Anti-HCA staining of partially dissected inner ear of controls (E) or inner ears electroporated with pGfp (F) or pSmad6 (G) at E3.5 and harvested at E8.5. (E) Anterior crista shows a typical saddle or W-shaped pattern with anti-HCA staining. (F) pGfp-treated inner ear with a canal pouch that is not resorbed (arrow), but the anterior crista appears normal. (G) pSmad6-treated inner ear showing a malformed and reduced anterior crista and no anterior canal. Arrows point to the outline of the ampulla. (H, I, J) Flattened anterior cristae from (E, F, G), respectively. Arrows in (H) and (I) point to the location of the septum cruciatum, and punctate staining represents stereocilia bundles on top of the sensory hair cells. Orientations: M, medial. Scale bars in (C), (E), and (H) apply to (A–D), (F–G), and (I–J), respectively.
Figure 9
Figure 9. Summary of crista formation and the potential roles of Bmp4.
(A) Schematic summary of crista formation from the prosensory to mature stage with sensory hair cells and supporting cells. The blue and yellow colors outside the crista represent mesenchymal Msx1- and Gata3- positive cells, respectively. Initially, a number of genes are co-expressed in the prosensory region (B), but these genes segregate into separate domains as sensory (blue) and non-sensory (yellow) fates are specified. Thus far, there is no experimental evidence that the crista prosensory region gives rise to neurons as in the prosensory regions for the maculae . (C) Within the crista epithelium (box), Bmp4 expression is regulated by Notch signaling, possibly mediated by Ser1. Whether Sox2 and Fgf10 regulate Bmp4 expression is not clear. Nevertheless, Bmp4 mediates crista formation by regulating Msx1 and Lmo4 in the sensory and Gata3, Lmo4 and p75Ngfr in the non-sensory (cruciatum) regions. Furthermore, deletion of genes such as Dlx (Dlx5 and Dlx6), Eya1, Hmx (Hmx2 and Hmx3), Tbx, and Six1 affects Bmp4 expression and crista formation. Among these genes, Tbx1 and possibly Dlx are co-expressed with Bmp4 in the crista.

References

    1. Chang W, Cole LK, Cantos R, Wu DK, editors. Molecular Genetics of vestibular organ development. New York: Springer-Verlag; 2003. pp. 11–56.
    1. Retzius G. Das Gehororgan der Wirbelthiere: Morphologisch-histologische Studien. Stockholm:in Commission bei Samson & Wallin 1881
    1. Wersall J, Bagger-Sjoback D. Morphology of the Vestibular Sense Organ. In: Autrum H, Jung R, Loenstein WR, Mackay DM, editors. Handbook of Sensory Physiology, Vestibular System Part I. New York: Springer-Verlag; 1974. pp. 124–170.
    1. Desai SS, Ali H, Lysakowski A. Comparative morphology of rodent vestibular periphery. II. Cristae ampullares. J Neurophysiol. 2005;93:267–280. - PubMed
    1. Landolt JP, Young ER, Correia MJ. Vestibular ampullary structures in the pigeon: a scanning electron microscope overview. Anat Rec. 1972;174:311–324. - PubMed

Publication types

MeSH terms

LinkOut - more resources