. 2008 Apr 11;4(4):e1000051.
doi: 10.1371/journal.pgen.1000051.

Beta-globin LCR and intron elements cooperate and direct spatial reorganization for gene therapy

Affiliations

Beta-globin LCR and intron elements cooperate and direct spatial reorganization for gene therapy

Alla Buzina et al. PLoS Genet. .

Abstract

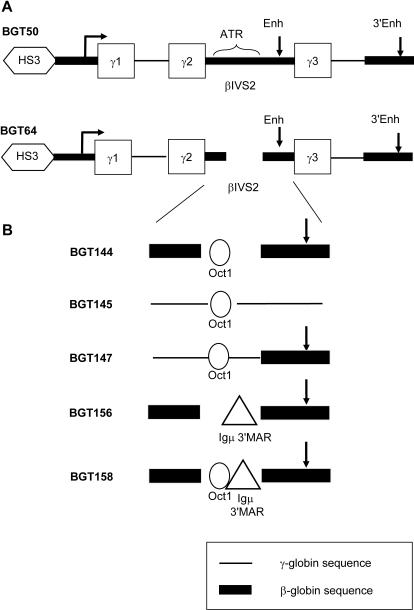
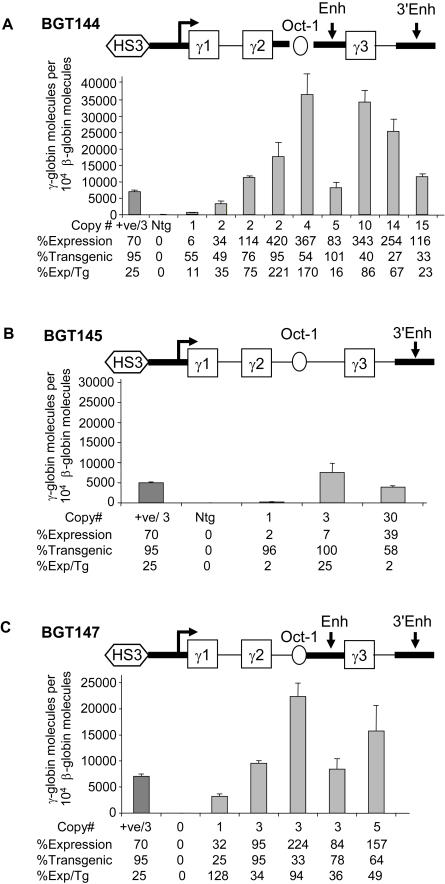
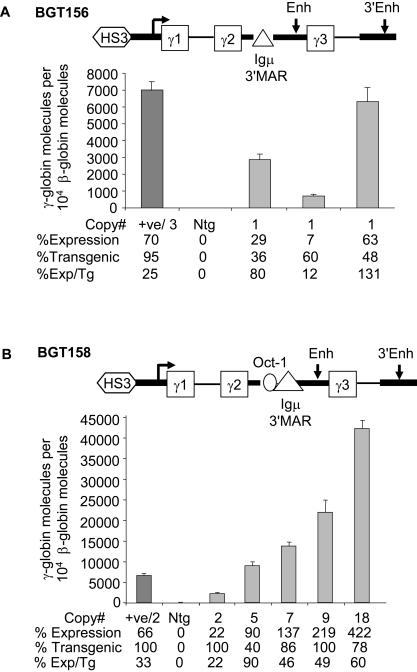
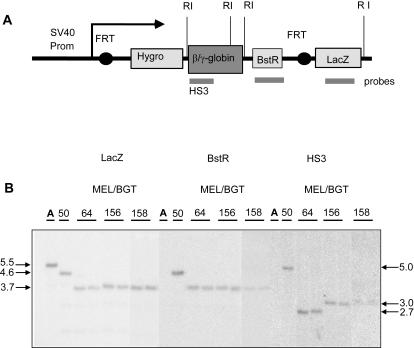
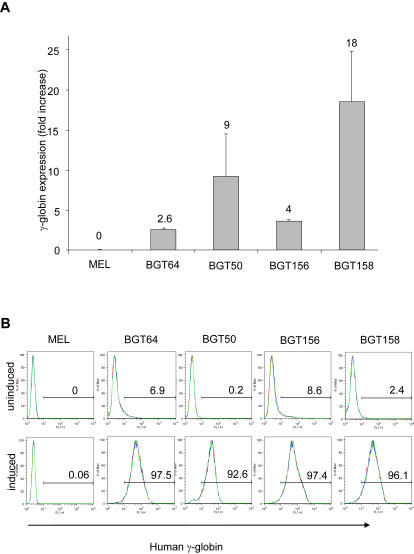
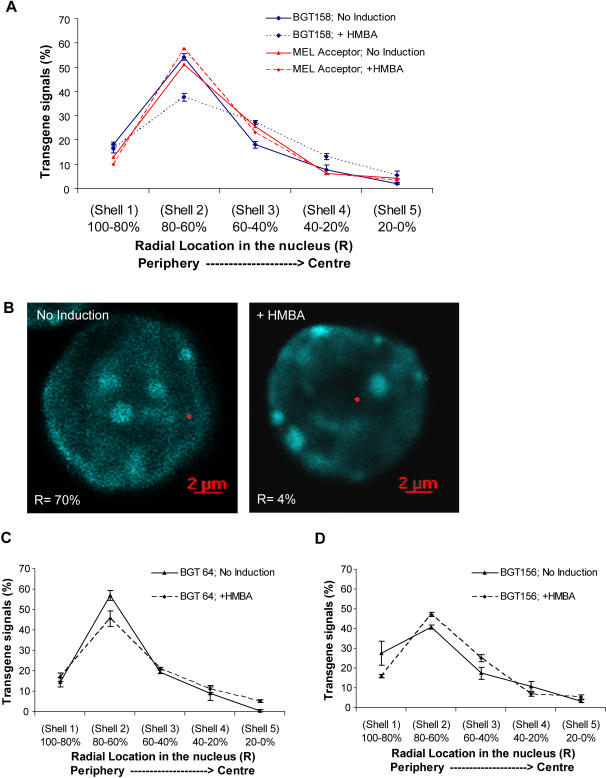
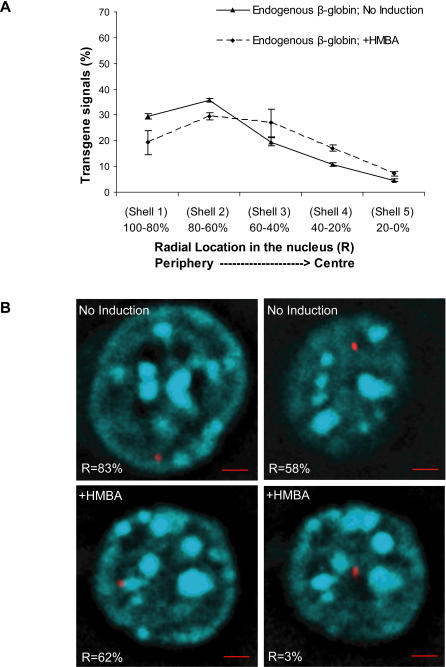
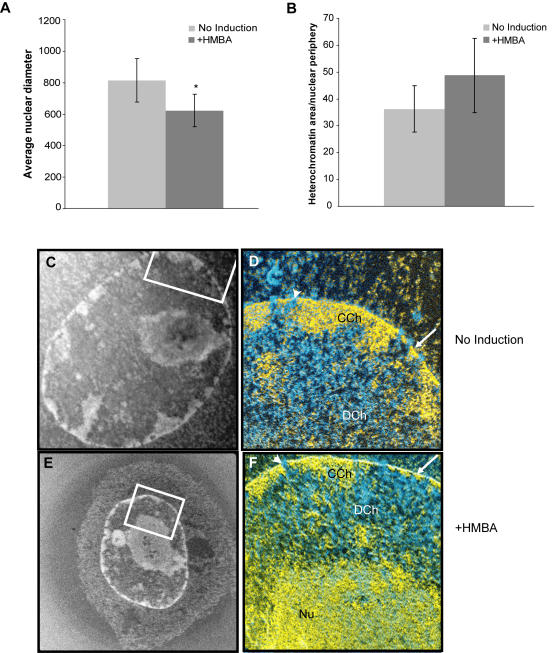
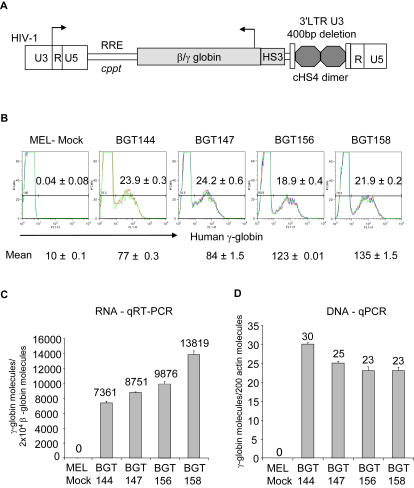
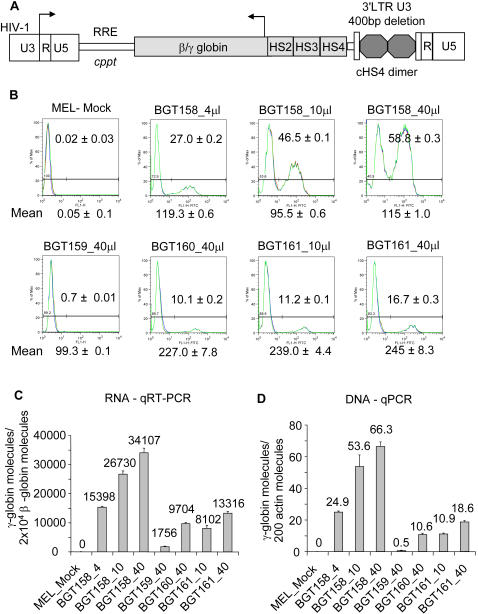
The Locus Control Region (LCR) requires intronic elements within beta-globin transgenes to direct high level expression at all ectopic integration sites. However, these essential intronic elements cannot be transmitted through retrovirus vectors and their deletion may compromise the therapeutic potential for gene therapy. Here, we systematically regenerate functional beta-globin intron 2 elements that rescue LCR activity directed by 5'HS3. Evaluation in transgenic mice demonstrates that an Oct-1 binding site and an enhancer in the intron cooperate to increase expression levels from LCR globin transgenes. Replacement of the intronic AT-rich region with the Igmu 3'MAR rescues LCR activity in single copy transgenic mice. Importantly, a combination of the Oct-1 site, Igmu 3'MAR and intronic enhancer in the BGT158 cassette directs more consistent levels of expression in transgenic mice. By introducing intron-modified transgenes into the same genomic integration site in erythroid cells, we show that BGT158 has the greatest transcriptional induction. 3D DNA FISH establishes that induction stimulates this small 5'HS3 containing transgene and the endogenous locus to spatially reorganize towards more central locations in erythroid nuclei. Electron Spectroscopic Imaging (ESI) of chromatin fibers demonstrates that ultrastructural heterochromatin is primarily perinuclear and does not reorganize. Finally, we transmit intron-modified globin transgenes through insulated self-inactivating (SIN) lentivirus vectors into erythroid cells. We show efficient transfer and robust mRNA and protein expression by the BGT158 vector, and virus titer improvements mediated by the modified intron 2 in the presence of an LCR cassette composed of 5'HS2-4. Our results have important implications for the mechanism of LCR activity at ectopic integration sites. The modified transgenes are the first to transfer intronic elements that potentiate LCR activity and are designed to facilitate correction of hemoglobinopathies using single copy vectors.


Conflict of interest statement

The authors have declared that no competing interests exist.

Figures

Figure 1
Figure 1. Maps of LCR β/γ-globin transgene constructs with intronic insertions of a consensus Oct-1 site or the Igμ 3′MAR element.
(A) The BGT50 cassette is comprised of 5′HS3, β-globin promoter, Aγ-globin exons 1-3, β-globin intron 2 (βIVS2) containing the AT-rich region (ATR) and intronic enhancer, and the 3′ β-globin enhancer. The BGT64 cassette contains the 372 bp ATR deletion. (B) Intronic modifications generated in the LCR β/γ-globin transgenes. BGT144 contains an Oct-1 site in place of the deleted ATR along with the intronic enhancer. BGT145 has an Oct-1 site in the Aγ-globin intron 2. BGT147 contains the Oct-1 site and intronic enhancer in a hybrid intron with 5′ Aγ-globin and 3′ β-globin sequences. BGT156 contains the Igμ 3′MAR in place of the deleted ATR along with the intronic enhancer. BGT158 contains the Oct-1 site 5′ of the Igμ 3′MAR in place of the deleted ATR and the intronic enhancer.
Figure 2
Figure 2. The Oct-1 site increases LCR β/γ-globin transgene expression by cooperating with the intronic enhancer.
(A) RNA expression analysis using qRT-PCR on fetal liver tissue from BGT144 transgenic animals. The mean expression per transgene from qRT-PCR performed in triplicate for BGT144 is 78% ±24 (standard error-SE). (B) qRT-PCR results from BGT145 transgenic animals show that mean expression per transgene is 10% ±8. C) qRT-PCR results from BGT147 transgenic animals show that mean expression per transgene 68% ±18. In each case, the amount of product from amplification reactions with a primer set specific for the human β/γ-globin transcript was scaled relative to 104 molecules from amplification reaction with primers specific for the mouse βmajor-globin gene. The positive control (+ve) is a previously published BGT64 sample (FF334) and the negative control (Ntg) is a nontransgenic animal.
Figure 3
Figure 3. The Igμ 3′MAR rescues LCR activity but consistent expression levels requires the Oct-1 site.
(A) qRT-PCR results from BGT156 transgenic animals show mean expression per transgene is 74% ±34. (B) qRT-PCR results from BGT158 transgenic animals show mean expression per transgene is 53% ±11. All samples analyzed as described in Figure 2, with the exception that the positive control (+ve) in BGT158 is fetal liver RNA from a previously characterized bred homozygous BGT50 mouse line.
Figure 4
Figure 4. Single copy integration of LCR β/γ-globin transgenes into a specific FRT site in MEL acceptor cells.
(A) Structure of the transgene after targeted insertion in MEL cells showing the location of EcoRI (R1) restriction sites and the LacZ, BstR and HS3 probes (grey lines). MEL acceptor DNA is cut 3′ of LacZ, and BGT50 is cut 3′ of LacZ and once within the β/γ-globin sequence. Two additional EcoRI sites were introduced in the 5′ and 3′ linkers during SFV vector subcloning of BGT64, BGT156, BGT158. (B) Southern blot analysis of genomic DNA cut with EcoRI. Hybridization with LacZ, BstR and HS3 probes confirms intactness of the integrated constructs. Hybridization with BstR and HS3 probes detects no band in the MEL acceptor cell line as expected, or a single band of the expected size for a single site transgene integration at the FRT site and the absence of random integrations.
Figure 5
Figure 5. The BGT158 transgene responds with the highest fold induction in MEL cells.
(A) qRT-PCR analysis of Aγ-globin RNA expression by MEL BGT64, MEL BGT156 and MEL BGT158 cell lines. Mean fold increase of RNA levels ±SE is shown on the third day after induction with 5 mM HMBA calculated from triplicate qRT-PCR samples from 2 independent clones for each transgene. MEL and MEL BGT50 cell lines are negative and positive controls respectively. (B) Flow cytometry with and without 6 days of HMBA induction shows the cell % expressing Aγ-globin protein, and demonstrates that all constructs produce roughly equivalent protein levels.
Figure 6
Figure 6. Nuclear relocalization of the BGT158 transgene in MEL cells during HMBA induction.
(A) Radial distribution of BGT158 transgene examined by 3D DNA FISH. The x-axis indicates percentage of the nuclear radius, in which 100-80% of the nucleus represents the periphery and 20-0% represents the centre. Each condition was repeated in three individual experiments with at least 80 transgene signals scored for each experiment. The data shown is the mean from all 3 experiments ±SE. (B) Examples of BGT158 transgene localization by 3D DNA FISH, with or without HMBA induction. The z-section containing the transgene signal used for radial measurements is shown. The transgene is detected in red with DIG labeled probe and tyramide signal amplication, and nuclear DNA is counterstained with DAPI (cyan). The number at the bottom of each panel represents the radial location in the nucleus shown. (C) Radial distribution of BGT64 and BGT156 transgenes examined by 3D DNA FISH as described in A above. BGT156 was repeated in three individual experiments with greater than 250 transgene signals scored. BGT64 was repeated in two individual experiments with greater than 160 transgene signals scored for each experiment.
Figure 7
Figure 7. Nuclear relocalization of the endogenous β-globin locus in MEL cells during HMBA induction.
(A) Radial distribution of the endogenous mouse β-globin locus examined by 3D DNA FISH as described in Figure 6. Each condition was repeated in three individual experiments with greater than 250 transgene signals scored. (B) Examples of endogenous mouse β-globin locus localization by 3D DNA FISH, with or without HMBA induction. Two z-sections from the same cell containing one FISH signal each are shown and were used for radial measurements. The transgene is detected in red with DIG labeled BAC probe, and nuclear DNA is counterstained with DAPI (cyan). The number at the bottom of each panel represents the radial location in the nucleus shown. Red scale bars indicate 2 µm.
Figure 8
Figure 8. Nuclear organization of ultrastructural heterochromatin in MEL cells during HMBA induction.
Electron Spectroscopic Imaging (ESI) analysis of undifferentiated and three-day differentiated MEL cells. (A) The average diameter of undifferentiated MEL cells changes upon HMBA differentiation. The diameters of sectioned cells were measured as described in the methods section. (B) The change in size is correlated to a small and statistically insignificant change in peripheral heterochromatin distribution after differentiation. Low magnification phosphorus enhanced mass images of a large undifferentiated nucleus (C) and a small differentiated (E) nucleus. Higher-resolution element specific ratio maps were acquired of regions of interest indicated by white boxes. Phosphorus element specific ratio maps were pseudo-coloured yellow and overlaid onto phosphorus subtracted nitrogen maps pseudo-coloured cyan. Phosphorus containing chromatin appears yellow and protein-rich regions are blue. An example of condensed chromatin regions are indicated (CCh) in both the undifferentiated (D) and differentiated (F) cells as is a decondensed region (DCh), the nucleolus is demarked by Nu and nuclear pores with a bold arrowhead and thinly represented condensed chromatin at the envelope with a white arrow.
Figure 9
Figure 9. Insulated SIN lentivirus vectors containing 5′HS3 β/γ-globin transgenes express in MEL cells.
(A) Map of the PL.SIN.cHS4 lentivirus showing the HIV 5′LTR, cppt, RRE, 5′HS3 β/γ-globin transgene and the 400 bp SIN deletion of the 3′LTR bearing the dimer core cHS4 Insulator. (B) Lentivirus vectors containing the intronic Igμ 3′MAR express the highest mean Aγ-globin protein levels assessed by flow cytometry of MEL cells infected at low MOI. Data with approximately 20% Aγ-globin protein expressing cells is shown by flow cytometry performed in triplicate ±SE after 6 days induction with HMBA. (C) Lentivirus vectors containing the intronic Igμ 3′MAR express the highest Aγ-globin RNA levels. qRT-PCR results in triplicate ±SE were performed on the 20% protein positive infected MEL cells after 3 days induction with HMBA. RNA expression is shown as Aγ-globin molecules per 2×10⁴ mouse βmajor-globin molecules after correction for the lentivirus copy number. (D) The lentivirus copy number is approximately equal in each infection. qPCR analysis of lentivirus copy number ±SE in the MEL cell genome. The number of transgene molecules was determined by amplification with 3′ β-globin enhancer primers and plotted versus 200 mouse β-actin molecules. These data correspond to the % of infected MEL cells.
Figure 10
Figure 10. Increased titer by the BGT158 intron 2 and complementation by other HS elements.
(A) Map of the PL.SIN.cHS4 lentivirus showing the LCR (5′HS2-4) β/γ-globin transgene and other components described in Figure 9. BGT159 contains the wild-type intron 2 from BGT50, BGT160 contains the BGT64 intron 2 with the deleted ATR (Figure 1A), and BGT161 contains the BGT158 modified intron 2 (Figure 1B). (B) The presence of 5′HS4 and 5′HS2 compensates for the absence of the intron 2 ATR in BGT160. BGT160 expresses high mean Aγ-globin protein levels assessed by flow cytometry of MEL cells performed in triplicate ±SE after 6 days induction with HMBA. The presence of the BGT158 modified intron 2 in BGT161 increases the viral titer but not the MFI. (C) qRT-PCR results in triplicate ±SE were performed on the infected MEL cells after 3 days induction with HMBA. RNA expression is shown as Aγ-globin molecules per 2×10⁴ mouse βmajor-globin molecules after correction for the lentivirus copy number. (D) The lentivirus copy number (detected by qPCR analysis as described in Figure 9D) is approximately equal to the % of Aγ-globin+ cells detected by flow cytometry.

Similar articles

Cited by

References

    1. Wijgerde M, Grosveld F, Fraser P. Transcription complex stability and chromatin dynamics in vivo. Nature. 1995;377:209–213. - PubMed
    1. Tolhuis B, Palstra RJ, Splinter E, Grosveld F, de Laat W. Looping and interaction between hypersensitive sites in the active beta-globin locus. Mol Cell. 2002;10:1453–1465. - PubMed
    1. Palstra RJ, Tolhuis B, Splinter E, Nijmeijer R, Grosveld F, et al. The beta-globin nuclear compartment in development and erythroid differentiation. Nat Genet. 2003;35:190–194. - PubMed
    1. Patrinos GP, de Krom M, de Boer E, Langeveld A, Imam AM, et al. Multiple interactions between regulatory regions are required to stabilize an active chromatin hub. Genes Dev. 2004;18:1495–1509. - PMC - PubMed
    1. Carter D, Chakalova L, Osborne CS, Dai YF, Fraser P. Long-range chromatin regulatory interactions in vivo. Nat Genet. 2002;32:623–626. - PubMed

Publication types

MeSH terms