. 2006 Nov;2(4):637-49.
doi: 10.1007/s11302-006-9011-5. Epub 2006 Jul 22.

Guanosine effect on cholesterol efflux and apolipoprotein E expression in astrocytes

Affiliations

Guanosine effect on cholesterol efflux and apolipoprotein E expression in astrocytes

Patrizia Ballerini et al. Purinergic Signal. 2006 Nov.

Abstract

The main source of cholesterol in the central nervous system (CNS) is represented by glial cells, mainly astrocytes, which also synthesise and secrete apolipoproteins, in particular apolipoprotein E (ApoE), the major apolipoprotein in the brain, thus generating cholesterol-rich high density lipoproteins (HDLs). This cholesterol trafficking, even though still poorly known, is considered to play a key role in different aspects of neuronal plasticity and in the stabilisation of synaptic transmission. Moreover, cell cholesterol depletion has recently been linked to a reduction in amyloid beta formation. Here we demonstrate that guanosine, which we previously reported to exert several neuroprotective effects, was able to increase cholesterol efflux from astrocytes and C6 rat glioma cells in the absence of exogenously added acceptors. In this effect the phosphoinositide 3 kinase/extracellular signal-regulated kinase 1/2 (PI3K/ERK1/2) pathway seems to play a pivotal role. Guanosine was also able to increase the expression of ApoE in astrocytes, whereas it did not modify the levels of ATP-binding cassette protein A1 (ABCA1), considered the main cholesterol transporter in the CNS. Given the emerging role of cholesterol balance in neuronal repair, these effects provide evidence for a role of guanosine as a potential pharmacological tool in the modulation of cholesterol homeostasis in the brain.


Figures

Figure 1
Figure 1
Expression of ABCA1 in rat brain cultured astrocytes and C6 rat glioma cells was investigated by RT-PCR and by Western blot. (a) Total RNA was isolated from the cells, and 2.5 µg was used for reverse transcription and then subjected to PCR amplification using primer pairs specific for this transporter. Amplification products of the expected size (331 bp) were resolved by agarose (1.5%) gel electrophoresis. M represents the size markers as indicated; lane 1 astrocytes, lane 2 C6 cells. (b) Total proteins were isolated from the cells, and equal amounts (50 µg) were separated on 12% SDS-polyacrylamide gel. ABCA1 protein was detected using a rabbit polyclonal anti-ABCA1 antibody. The immunoblot was also stripped, and western blotting with β actin antibody was used as a loading control. Lane 1 astrocytes; lane 2 C6 cells. Results are representative of experiments carried out with RNA and protein isolated from at least three independent cell culture seedings
Figure 2
Figure 2
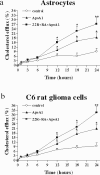
Time course of apolipoprotein-dependent cholesterol efflux in rat brain cultured astrocytes (a) and C6 cells (b) treated with LXR/RXR ligands. Cells were loaded for 24 h with [3H]cholesterol (2 µCi/ml), allowed to equilibrate for 24 h with 2 mg/ml BSA, and treated with ApoA1 (15 µg/ml) in the presence or absence of 22R+RA (10 µM each). Media and cell lysates were subjected to liquid scintillation counting. Cholesterol efflux, expressed as a percentage, was calculated as reported in Materials and methods. Data points were measured in triplicate and represent the mean ± SEM of three independent experiments. *P < 0.05, **P < 0.005 versus control (Student’s t-test)
Figure 3
Figure 3
Time course of cholesterol efflux from C6 rat glioma cells in both basal conditions and after treatment with 300 µM guanosine. Cells were loaded for 24 h with [3H]cholesterol (2 µCi/ml), incubated for 24 h with 2 mg/ml BSA and treated with guanosine (300 µM) for the indicated periods. Radioactivity was evaluated in both media and cell lysates. Cholesterol efflux, expressed as a percentage, was calculated as reported in Materials and methods. Data points were measured in triplicate and represent the mean ± SEM of four independent experiments. *P < 0.05, **P < 0.005, ***P < 0.0005 versus untreated cells (Student’s t-test)
Figure 4
Figure 4
Dose-dependent increase of cholesterol efflux induced by guanosine in rat brain cultured astrocytes and C6 rat glioma cells. Following labelling and equilibration, cells were incubated with the indicated concentrations of guanosine. After 1 h, radioactivity in the media and in the cell lysates was measured and cholesterol efflux calculated, as reported in Materials and methods. Data points were measured in triplicate and represent the mean ± SEM of four independent experiments
Figure 5
Figure 5
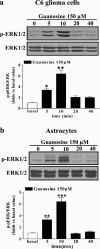
Time-dependent increase of ERK1/2 phosphorylation induced by guanosine in rat brain cultured C6 rat glioma cells (a) and astrocytes (b). Cells were serum deprived for 24 h and then treated for the indicated periods with 150 µM guanosine. Cell lysates were prepared as described in Materials and methods and immunoblotted with phospho-ERK specific antibodies. After development, the membranes were stripped and re-probed with regular antibody against ERK1/2. The blots are representative of at least three independent experiments with similar results. Immunoblots were quantified by densitometric analysis, and the ERK1/2 values, normalised to the corresponding β actin values, are expressed as number of times of increase versus basal values (untreated cells) in the histograms under the blots. Data are mean ± SEM of three independent experiments. *P < 0.05, **P < 0.005, ***P < 0.0005 versus basal values (Student’s t-test)
Figure 6
Figure 6
Effect of the MEK1/2 inhibitor PD98059 on cholesterol efflux induced by guanosine. Following labelling and equilibration, cells were pre-incubated for 30 min with PD98059 (30 µM) and then treated with 150 µM guanosine. After 1 h radioactivity in media and in cell lysates was measured and cholesterol efflux calculated, as reported in Materials and methods. Data points were measured in triplicate and represent the mean ± SEM of three independent experiments. #P < 0.0001 guanosine-treated cells versus untreated cells, *P < 0.005 PD98059-treated cells versus guanosine-treated cells (Student’s t-test)
Figure 7
Figure 7
Effect of inhibitors of PKC and PKA on the cholesterol efflux induced by guanosine. Following labelling and equilibration, cells were pre-incubated for 30 min with calphostin C (100 nM), to inhibit PKCs, or for 3 h with KT5720 (1 µM), to inhibit PKA, and then treated with 150 µM guanosine. After 1 h the radioactivity in media and cell lysates was measured and cholesterol efflux calculated, as reported in Materials and methods. Data points were measured in triplicate and represent the mean ± SEM of three independent experiments. #P < 0.0001 guanosine-treated cells versus untreated cells, *P < 0.05 calphostin C-treated or KT5720-treated cells versus guanosine-treated cells (Student’s t-test)
Figure 8
Figure 8
Effect of the PI3K inhibitor LY294002 alone or in combination with the MEK1/2 inhibitor PD98059 on cholesterol efflux induced by guanosine. Following labelling and equilibration, cells were pre-incubated for 30 min with LY294002 (30 µM) or with LY294002 (30 µM) plus PD98059 (30 µM) and then treated with 150 µM guanosine. After 1 h the radioactivity in media and cell lysates was measured and cholesterol efflux calculated as reported in Materials and methods. Data points were measured in triplicate and represent the mean ± SEM of three independent experiments. ##P < 0.0001 guanosine-treated cells versus untreated C6 cells, #P < 0.0005 guanosine-treated astrocytes versus untreated astrocytes, **P < 0.005 LY294002-treated or LY294002+ PD98059-treated cells versus guanosine-treated C6 cells, *P < 0.05 LY294002-treated or LY294002+ PD98059-treated astrocytes versus guanosine-treated astrocytes (Student’s t-test)
Figure 9
Figure 9
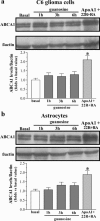
Time course of ABCA1 expression induced by 150 µM guanosine in (a) C6 rat glioma cells and (b) rat brain cultured astrocytes. Cells were serum deprived for 24 h and were treated for the indicated periods with 150 µM guanosine or with ApoA1 (15 µg/ml) plus 22R (10 µg/ml) and RA (10 µg/ml). Fifty microgrammes of total protein were loaded per lane and immunoblotted with rabbit polyclonal antibody to ABCA1. Western blotting with β actin antibody was used as a loading control. The blots are representative of three independent experiments with similar results. Immunoblots were quantified by densitometric analysis, and the ABCA1 values, normalised to the corresponding β actin values, are expressed as number of times of increase versus basal values (untreated cells) in the histograms under the blots. Data are mean ± SEM of three independent experiments. *P < 0.05 versus basal values (Student’s t-test)
Figure 10
Figure 10
Modulation of ApoE expression by ApoA1 plus LXR/RXR ligands and guanosine in rat brain cultured astrocytes by Northern blot (a) and Western blot (b). Cells were treated for 12 h with a combination of 15 µg/ml ApoA1, 10 µM 22R and 10 µM RA or for 1 h with 150 µM guanosine. At the end of the periods of treatment (a) total RNA was isolated as described in Materials and methods and equal amounts were electrophoresed through formaldehyde-containing gel, transferred to Nylon membrane and hybridised with 32P-labelled cDNA probes. 28S probe was used as control for loading and integrity of the RNAs. The blot is representative of at least three independent experiments. Values from densitometric analysis were normalised to those of 28S and expressed as number of times of increase versus basal values (untreated cells) in the histograms under the blot. Data are mean ± SEM of three independent experiments. *P < 0.05, **P < 0.005 versus basal values (Student’s t-test). (b) ApoE levels in whole cell lysates were determined using a monoclonal anti-ApoE antibody. β actin was used as loading control. Immunoblots were quantified by densitometric analysis and the ApoE values, normalised to the corresponding β actin values, are expressed as number of times of increase versus basal values (untreated cells) in the histograms under the blots. Data are mean ± SEM of three independent experiments. *P < 0.05, **P < 0.005 versus basal values (Student’s t-test)

References

    1. {'text': '', 'ref_index': 1, 'ids': [{'type': 'PubMed', 'value': '11481254', 'is_inner': True, 'url': 'https://pubmed.ncbi.nlm.nih.gov/11481254/'}]}
    2. Koudinov AR, Koudinova NV (2001) Essential role for cholesterol in synaptic plasticity and neuronal degeneration. FASEB J 15:1858′860 - PubMed
    1. {'text': '', 'ref_index': 1, 'ids': [{'type': 'DOI', 'value': '10.1016/j.mcn.2005.02.006', 'is_inner': False, 'url': 'https://doi.org/10.1016/j.mcn.2005.02.006'}, {'type': 'PubMed', 'value': '15911344', 'is_inner': True, 'url': 'https://pubmed.ncbi.nlm.nih.gov/15911344/'}]}
    2. Goritz C, Mauch DH, Pfrieger FW (2005) Multiple mechanisms mediate cholesterol-induced synaptogenesis in a CNS neuron. Mol Cell Neurosci 29:190′01 - PubMed
    1. {'text': '', 'ref_index': 1, 'ids': [{'type': 'DOI', 'value': '10.1074/jbc.M308798200', 'is_inner': False, 'url': 'https://doi.org/10.1074/jbc.m308798200'}, {'type': 'PubMed', 'value': '14660672', 'is_inner': True, 'url': 'https://pubmed.ncbi.nlm.nih.gov/14660672/'}]}
    2. Taverna E, Saba E, Rowe J et al (2004) Role of lipid microdomains in P/Q-type calcium channel (Cav2.1) clustering and function in presynaptic membranes. J Biol Chem 279:5127′134 - PubMed
    1. {'text': '', 'ref_index': 1, 'ids': [{'type': 'PubMed', 'value': '11571339', 'is_inner': True, 'url': 'https://pubmed.ncbi.nlm.nih.gov/11571339/'}]}
    2. Simons M, Keller P, Dichgans J et al (2001) Cholesterol and Alzheimer’s disease: is there a link? Neurology 57:1089′093 - PubMed
    1. {'text': '', 'ref_index': 1, 'ids': [{'type': 'DOI', 'value': '10.1073/pnas.95.11.6460', 'is_inner': False, 'url': 'https://doi.org/10.1073/pnas.95.11.6460'}, {'type': 'PMC', 'value': 'PMC27798', 'is_inner': False, 'url': 'https://pmc.ncbi.nlm.nih.gov/articles/PMC27798/'}, {'type': 'PubMed', 'value': '9600988', 'is_inner': True, 'url': 'https://pubmed.ncbi.nlm.nih.gov/9600988/'}]}
    2. Simons M, Keller P, De Strooper B et al (1998) Cholesterol depletion inhibits the generation of beta-amyloid in hippocampal neurons. Proc Natl Acad Sci USA 95:6460′464 - PMC - PubMed

LinkOut - more resources