. 2005 Sep;1(3):281-92.
doi: 10.1007/s11302-005-8132-6. Epub 2005 Jul 29.

Tri-nucleotide receptors play a critical role in epithelial cell wound repair

Affiliations

Tri-nucleotide receptors play a critical role in epithelial cell wound repair

Ilene Weinger et al. Purinergic Signal. 2005 Sep.

Abstract

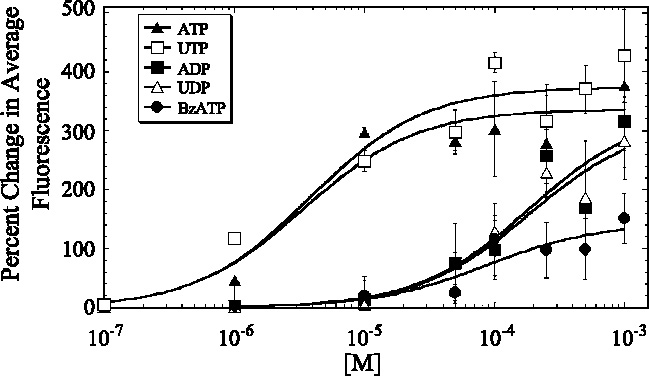
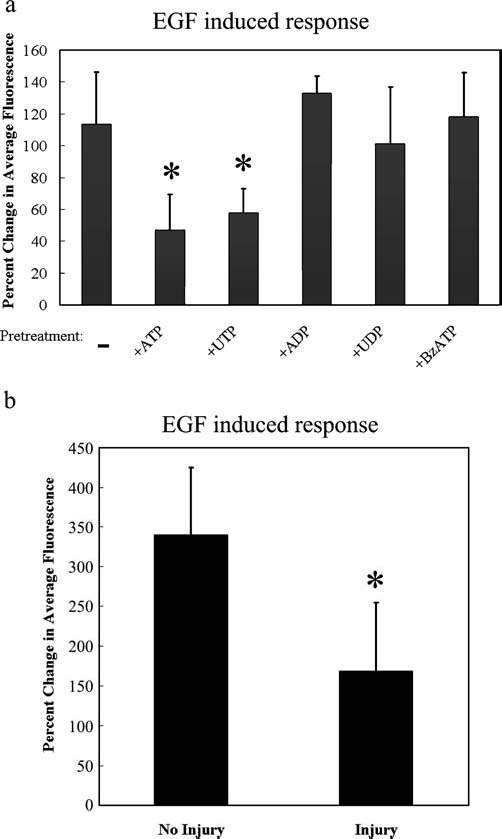
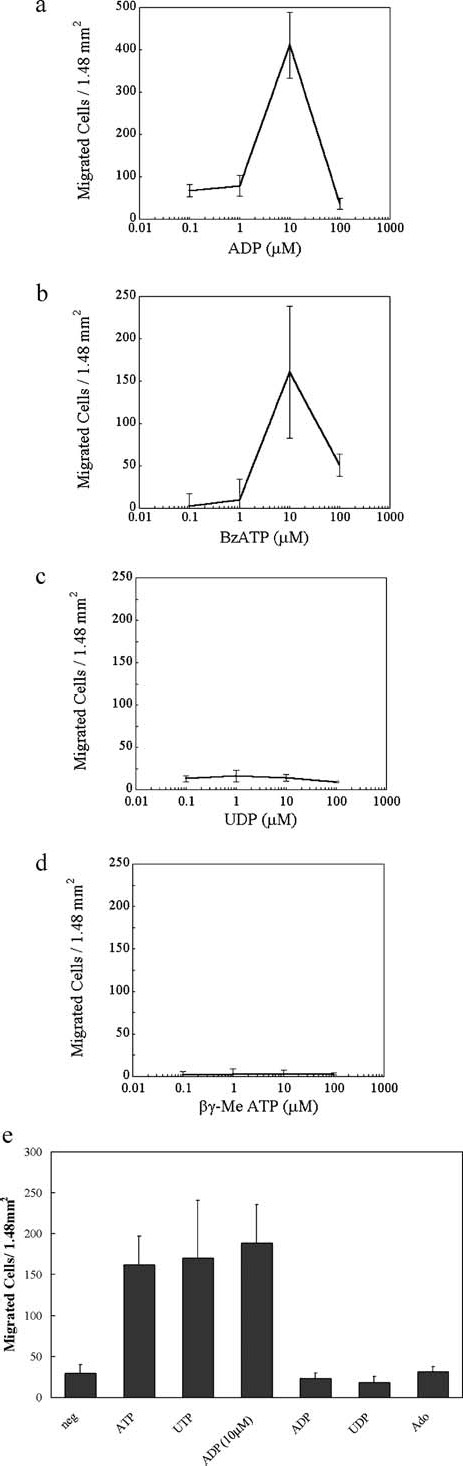
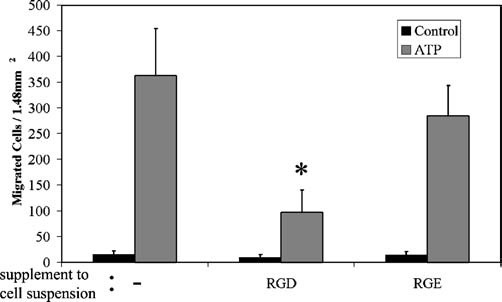
The cornea plays a major role in the refraction of light to the retina. Therefore, the integrity and transparency of the corneal epithelium are critical to vision. Following injury, a combination of rapid signal transduction events and long-term cell migration are essential for wound closure. We have demonstrated previously that injury resulted in the release of nucleotides that induce the propagation of a Ca(2+) wave to neighboring cells. This suggests that nucleotides and their receptors are critical components of wound healing. Epidermal growth factor (EGF) and integrins also have been shown to play a role in injury. In this study, we demonstrate that pretreatment of cells with ATP and UTP inhibited the immediate wound response, while BzATP, ADP, and UDP did not affect this response. Tri-nucleotide pretreatment also reduced the EGF induced Ca(2+) response. Additionally, lower EC(50) concentrations of ATP and UTP triggered migration of cells that was enhanced further with EGF and was inhibited by the tripeptide, RGD. Results indicate that the desensitization induced by ATP and UTP was specific. While ADP and UDP cause a homologous desensitization of their own signal, they did not cause an inhibition of the wound response nor does BzATP. Neither Ca(2+) wave propagation nor cell migration occurred in response to beta,gamma-MeATP. Together these results lead us to hypothesize that corneal epithelial wound repair is mediated by both P2Y(2) and P2Y(4) receptors.


Figures

Figure 1
Figure 1
Nucleotide induced Ca2+ dose response curves. HCE-T cells were incubated in 5 µM Fluo-3AM for 30 min and imaged every 786 ms using a flow through apparatus on an LSM 510 confocal. Cells were stimulated with the indicated concentration of nucleotide for 60 s. Maximal percent change in average fluorescence of a 460 µm × 460 µm field was determined. Data was fit to a generalized single-site binding model. Graph represents a minimum of three experiments at each concentration tested.
Figure 2
Figure 2
Pre-stimulation with ATP inhibits injury induced Ca2+ wave. Primary corneal epithelial cells were incubated in 5 µM Fluo-3AM for 30 min and imaged in a flow through apparatus on an LSM 510 confocal. Cells were washed in HEPES buffered saline with Ca2+ for at least 30 s, and stimulated by wounding or with ATP. Individual cells were analyzed for percent change in average fluorescence. Intensity scale is shown in (a) with red indicating highest Ca2+ levels and blue indicating lowest Ca2+ levels. The horizontal white bar in (a) represents 100 µm. a) Cells were washed in HEPES buffer containing Ca2+ and wounded. A series of images taken from a time course of a representative experiment of a wound (shown at asterisk) is presented. b) A single image taken after wounding is shown. Cells (#1–5) immediately adjacent to the wound (c) and cells away (#6–10) from the wound (d) were analyzed. e) Cells were washed in HEPES buffer containing Ca2+, stimulated with 100 µM ATP (80 s), and wounded (157 s). A series of images taken from a time course of a representative experiment is presented (wound shown at asterisk). f) A single image taken after wounding is shown. Cells (#1–5) immediately adjacent to the wound (g) and cells away (#6–10) from the wound (h) were analyzed. Images are representative of at least 10 independent experiments.
Figure 5
Figure 5
Ca2+ free media inhibits an injury response after ATP stimulation. Primary corneal epithelial cells were incubated in 5 µM Fluo-3AM for 30 min and imaged in a flow through apparatus on an LSM 510 confocal. Cells were washed in HEPES buffered saline for at least 30 s, and stimulated by wounding or ATP. Individual cells were analyzed for percent change in average fluorescence. Intensity scale is shown in (a) with red indicating highest Ca2+ levels and blue indicating lowest Ca2+ levels. The horizontal white bar in (a) represents 100 µm. a) Cells were pre incubated in BAPTA (100 µM) washed in HEPES buffer containing Ca2+ and wounded. A series of images taken from a time course of a wound (shown at asterisk) of a representative experiment is presented. b) A single image taken after wounding is shown. Cells (#1–5) immediately adjacent to the wound (c) and cells away (#6–10) from the wound (d) were analyzed. e) Cells were washed in Ca2+ free HEPES buffer containing EGTA, stimulated with 100 µM ATP, and wounded. A series of images taken from a representative time course is presented (wound shown at asterisk). f) A single image taken after wounding is shown. Cells (#1–5) immediately adjacent to the wound (g) and cells away (#6–10) from the wound (h) were analyzed. Images are representative of at least 10 independent experiments. The series of images are taken from Movie 2 (see online version of article at www.springeronline.com).
Figure 3
Figure 3
Tri-nucleotides attenuate the injury induced Ca2+ wave. Primary corneal epithelial cells were incubated in 5 µM Fluo-3AM for 30 min and imaged in a flow through apparatus on an LSM 510 confocal. Cells were washed in HEPES buffered saline with Ca2+ for at least 30 s and stimulated with the indicated nucleotide and wounded. Intensity scale is shown in (a) with red indicating highest Ca2+ levels and blue indicating lowest Ca2+ levels. The horizontal white bar in (a) represents 100 µm. a, b) Cells were washed in HEPES buffer with Ca2+, stimulated with 100 µM of the indicated nucleotide, and wounded. A series of images taken from a time course of a representative experiment is presented (wound shown at asterisk). c, d) Percent change in average fluorescence for the whole field (460 µm × 460 µm) was calculated and graphed over the time course for each experiment. Images are representative of at least 10 independent experiments. Series of images are taken from Movie 1 (see online version of article at www.springeronline.com).
Figure 4
Figure 4
Di-nucleotides and BzATP do not attenuate the injury induced Ca2+ wave. Primary corneal epithelial cells were incubated in 5 µM Fluo-3AM for 30 min and imaged in a flow through apparatus on an LSM 510 confocal. Cells were washed in HEPES buffered saline with Ca2+ for at least 30 s and stimulated with the indicated nucleotide and wounded. Intensity scale is shown in (a) with red indicating highest Ca2+ levels and blue indicating lowest Ca2+ levels. The horizontal white bar in (a) represents 100 µm. (a–c) Cells were washed in HEPES buffer with Ca2+, stimulated with 100 µM of the indicated nucleotide, and wounded. A series of images taken from a time course of a representative experiment is presented (wound shown at asterisk). (d–f) Percent change in average fluorescence for the whole field (460 µm × 460 µm) was calculated and graphed over the time course for each experiment. Images are representative of at least 10 independent experiments. Series of images are taken from Movie 1 (see online version of article at www.springeronline.com).
Figure 6
Figure 6
Injury and tri-nucleotides decrease subsequent EGF induced Ca2+ response. HCE-T cells were incubated in 5 µM Fluo-3AM for 30 min and imaged every 786 ms in a flow through apparatus on an LSM 510 confocal. a) Cells were stimulated with 100 µM of the indicated nucleotide for 100 s, washed in HEPES buffered saline for 100 s, and then stimulated with 8 nM EGF or stimulated with EGF without pretreatment. Maximal percent change in average fluorescence of a 460 µm × 460 µm field was determined. b) Cells were either wounded and stimulated with 8 nM EGF or stimulated with EGF without injury. Individual cells were selected for analysis. In the wound model, cells that responded to the wound were selected. (t-test, * P < 0.0005) Data represent a minimum of three independent experiments.
Figure 7
Figure 7
Cell migration is nucleotide specific. Transwell migrations were performed for 8 h at 37 °C with the indicated nucleotide. HCE-T cells were stained with propidium iodide, counted in six randomly chosen fields (1.46 mm2), and averaged. Dose response curves for a) ADP, b) BzATP, c) UDP, and d) β,γ-MeATP are shown. Experiments were performed at least three times and representative curves were chosen. e) Cells were stimulated with binding buffer (neg), 1 µM ATP, UTP, ADP, UDP, or Adenosine (Ado), or 10 µM ADP. Experiments were performed in triplicate.
Figure 8
Figure 8
Wound media, nucleotides, and EGF mediate cell migration. Transwell migrations were performed for 8 h at 37 °C with the indicated nucleotides and/or EGF. HCE-T cells were stained with propidium iodide, counted in six randomly chosen fields (1.46 mm2) and averaged. a) Migration of cells stimulated with wound media were compared to those stimulated with unwounded control media, wound media treated with apyrase and binding buffer (negative). b) A representative experiment is shown where cells were stimulated with optimal concentration of ATP (1 µM) and EGF (0.16 nM) and compared to co-stimulation with ATP and EGF and negative binding buffer. c) Cells were simulated with binding buffer (neg), 1 µM UTP, ADP, or UDP, or 10 µM ADP +/− 0.16 nm EGF.
Figure 9
Figure 9
ATP and integrins mediate cell migration. Transwell migrations were performed for 8 h at 37 °C with the indicated nucleotides. HCE-T cells were stained with propidium iodide, counted in six randomly chosen fields (1.46 mm2) and averaged. RGD or RGE peptide, 1 µM, was added to the cell suspension. Cells were stimulated with binding buffer (control) or 1 µM ATP. (t-test, *P < 0.0005) Experiments were performed in triplicate.

Similar articles

Cited by

References

    1. {'text': '', 'ref_index': 1, 'ids': [{'type': 'DOI', 'value': '10.1016/S0028-3908(97)00125-1', 'is_inner': False, 'url': 'https://doi.org/10.1016/s0028-3908(97)00125-1'}, {'type': 'PubMed', 'value': '9364468', 'is_inner': True, 'url': 'https://pubmed.ncbi.nlm.nih.gov/9364468/'}]}
    2. Burnstock G. The past, present and future of purine nucleotides as signalling molecules. Neuropharmacology 1997; 36(9): 1127–39. - PubMed
    1. {'text': '', 'ref_index': 1, 'ids': [{'type': 'DOI', 'value': '10.1254/jjp.78.113', 'is_inner': False, 'url': 'https://doi.org/10.1254/jjp.78.113'}, {'type': 'PubMed', 'value': '9829617', 'is_inner': True, 'url': 'https://pubmed.ncbi.nlm.nih.gov/9829617/'}]}
    2. Abbracchio MP, Burnstock G. Purinergic signalling: Pathophysiological roles. Jpn J Pharmacol 1998; 78(2): 113–45. - PubMed
    1. {'text': '', 'ref_index': 1, 'ids': [{'type': 'PMC', 'value': 'PMC6782585', 'is_inner': False, 'url': 'https://pmc.ncbi.nlm.nih.gov/articles/PMC6782585/'}, {'type': 'PubMed', 'value': '10341225', 'is_inner': True, 'url': 'https://pubmed.ncbi.nlm.nih.gov/10341225/'}]}
    2. Neary JT, Kang Y, Bu Y et al. Mitogenic signaling by ATP/P2Y purinergic receptors in astrocytes: Involvement of a calcium-independent protein kinase C, extracellular signal-regulated protein kinase pathway distinct from the phosphatidylinositol-specific phospholipase C/Calcium pathway. J Neurosci 1999; 19(11): 4211–20. - PMC - PubMed
    1. {'text': '', 'ref_index': 1, 'ids': [{'type': 'DOI', 'value': '10.1016/S0005-2736(03)00210-4', 'is_inner': False, 'url': 'https://doi.org/10.1016/s0005-2736(03)00210-4'}, {'type': 'PubMed', 'value': '12948585', 'is_inner': True, 'url': 'https://pubmed.ncbi.nlm.nih.gov/12948585/'}]}
    2. Schwiebert EM, Zsembery A. Extracellular ATP as a signaling molecule for epithelial cells. Biochim Biophys Acta (BBA) — Biomembranes 2003; 1615(1–2): 7–32. - PubMed
    1. {'text': '', 'ref_index': 1, 'ids': [{'type': 'PubMed', 'value': '11739651', 'is_inner': True, 'url': 'https://pubmed.ncbi.nlm.nih.gov/11739651/'}]}
    2. Klepeis VE, Cornell-Bell A, Trinkaus-Randall V. Growth factors but not gap junctions play a role in injury-induced Ca2+ waves in epithelial cells. J Cell Sci 2001; 114(23): 4185–95. - PubMed

LinkOut - more resources