

Optimizing measurement of the electrical anisotropy of muscle
- PMID: 18404614
- PMCID: PMC2742672
- DOI: 10.1002/mus.20981
Optimizing measurement of the electrical anisotropy of muscle
Abstract
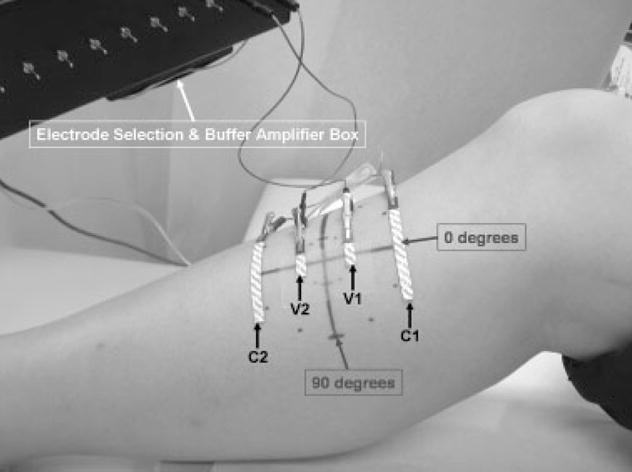
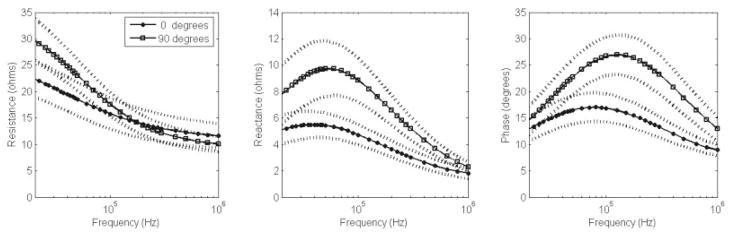
Skeletal muscle is electrically anisotropic, with applied high-frequency electrical current flowing more easily along than across muscle fibers. As an early step in harnessing this characteristic for clinical use, we studied approaches for maximizing the measured anisotropy by varying electrode size and applied current frequency in the tibialis anterior of 10 normal subjects. The results were compared to those from two patients with amyotrophic lateral sclerosis (ALS). Current was applied percutaneously, first parallel and then perpendicular to the major fiber direction of the muscle at frequencies ranging from 20 kHZ to 1 MHZ, using a fixed voltage-electrode length and varying the current-electrode length. The measured anisotropy was most pronounced using the longest length current electrodes and with a 125-kHZ applied frequency for the major outcome parameter phase. In addition, the two ALS patients showed very distinct anisotropic patterns. These results support the belief that, with the appropriate measurement technique, non-invasive assessment of electrical anisotropy of muscle may have useful clinical application.
Figures


References
-
- Aaron R, Huang M, Shiffman CA. Anisotropy of human muscle via non-invasive impedance measurements. Phys Med Biol. 1997;42:1245–1262. - PubMed
-
- Burger HC, van Dongen R. Specific electrical resistance of body tissues. Phys Med Biol. 1961;5:431–447. - PubMed
-
- Epstein BR, Foster KR. Anisotropy in the dielectric properties of skeletal muscle. Med Biol Eng Comput. 1983;21:51–55. - PubMed
-
- Esper GJ, Shiffman CA, Aaron R, Lee KS, Rutkove SB. Assessing neuromuscular disease with multifrequency electrical impedance myography. Muscle Nerve. 2006;34:595–602. - PubMed
-
- Rush S, Abildskov JA, McFee R. Resistivity of body tissues at low frequencies. Circ Res. 1963;12:40–50. - PubMed
Publication types
MeSH terms
Grants and funding
LinkOut - more resources
Full Text Sources
Other Literature Sources
Research Materials
Miscellaneous
