

Integrin alpha IIb beta 3 in a membrane environment remains the same height after Mn2+ activation when observed by cryoelectron tomography
- PMID: 18405917
- PMCID: PMC2614134
- DOI: 10.1016/j.jmb.2008.03.014
Integrin alpha IIb beta 3 in a membrane environment remains the same height after Mn2+ activation when observed by cryoelectron tomography
Abstract
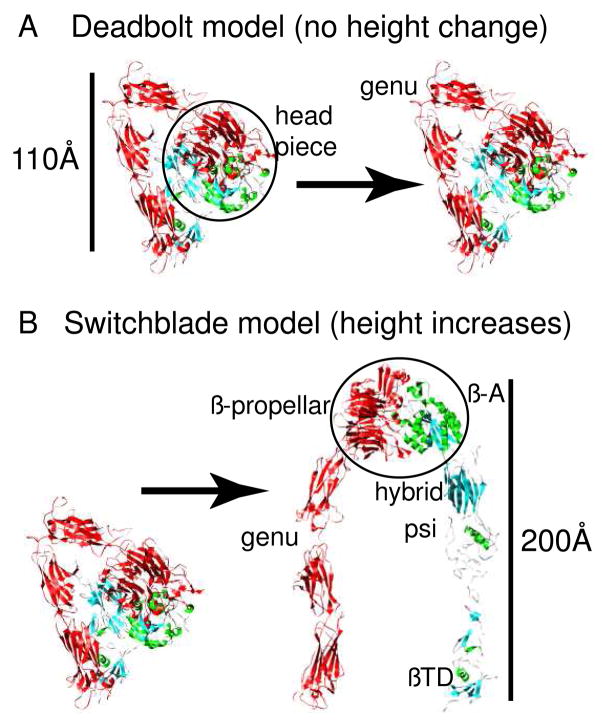
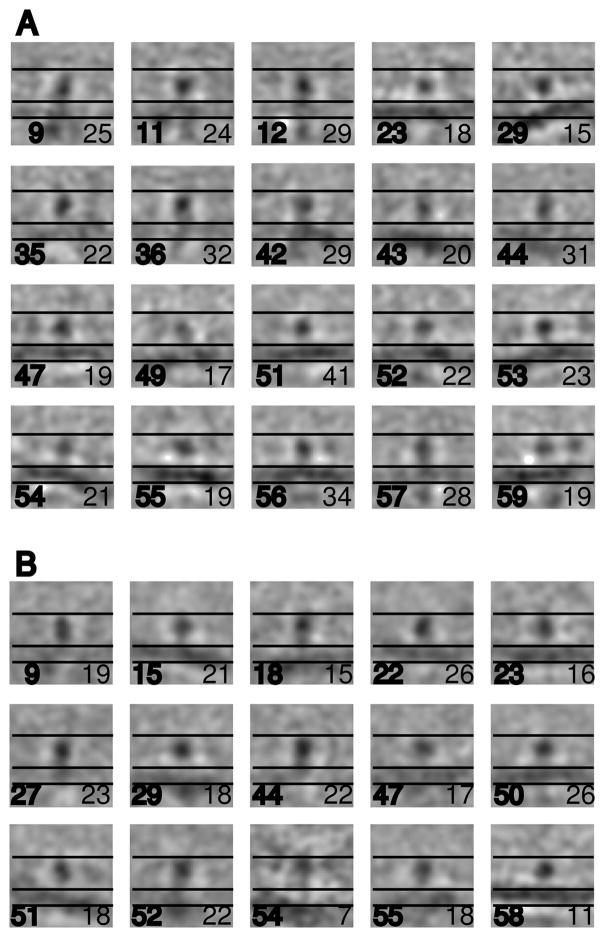
Integrins perform the critical function of signalling cell attachment to the extracellular matrix or to other cells. This signalling is done through a structural change propagated bidirectionally across the plasma membrane. Integrin activation has been extensively studied with ectodomain constructs, but the structural change within intact, membrane-bound molecules remains a subject of live debate. Using cryoelectron tomography, we examined the simplest predication of the different integrin activation models, i.e., the change in height of the molecules. Analysis using techniques that compensate for the missing wedge during alignment and averaging and that search for patterns in the structure of the aligned molecular subvolumes extracted from the tomogram reveals that the vast majority of molecules show no dramatic height change upon Mn(2+)-induced activation of membrane-bound integrins when compared with an inactive integrin control group. Thus, the result is inconsistent with the switchblade activation model.
Figures
Similar articles
-
The Structure of a Full-length Membrane-embedded Integrin Bound to a Physiological Ligand.J Biol Chem. 2015 Nov 6;290(45):27168-27175. doi: 10.1074/jbc.M115.682377. Epub 2015 Sep 21. J Biol Chem. 2015. PMID: 26391523 Free PMC article.
-
Drug-induced activation of integrin alpha IIb beta 3 leads to minor localized structural changes.PLoS One. 2019 Apr 12;14(4):e0214969. doi: 10.1371/journal.pone.0214969. eCollection 2019. PLoS One. 2019. PMID: 30978226 Free PMC article.
-
Global conformational rearrangements in integrin extracellular domains in outside-in and inside-out signaling.Cell. 2002 Sep 6;110(5):599-11. doi: 10.1016/s0092-8674(02)00935-2. Cell. 2002. PMID: 12230977
-
Clues for understanding the structure and function of a prototypic human integrin: the platelet glycoprotein IIb/IIIa complex.Thromb Haemost. 1994 Jul;72(1):1-15. Thromb Haemost. 1994. PMID: 7974356 Review.
-
On the structure and function of platelet integrin alpha IIb beta 3, the fibrinogen receptor.Proc Soc Exp Biol Med. 1995 Apr;208(4):346-60. doi: 10.3181/00379727-208-43863a. Proc Soc Exp Biol Med. 1995. PMID: 7535429 Review.
Cited by
-
Annular anionic lipids stabilize the integrin αIIbβ3 transmembrane complex.J Biol Chem. 2015 Mar 27;290(13):8283-93. doi: 10.1074/jbc.M114.623504. Epub 2015 Jan 29. J Biol Chem. 2015. PMID: 25632962 Free PMC article.
-
Conformational Equilibrium of Human Platelet Integrin Investigated by Three-Dimensional Electron Cryo-Microscopy.Subcell Biochem. 2018;87:353-363. doi: 10.1007/978-981-10-7757-9_12. Subcell Biochem. 2018. PMID: 29464566 Free PMC article. Review.
-
The Structure of a Full-length Membrane-embedded Integrin Bound to a Physiological Ligand.J Biol Chem. 2015 Nov 6;290(45):27168-27175. doi: 10.1074/jbc.M115.682377. Epub 2015 Sep 21. J Biol Chem. 2015. PMID: 26391523 Free PMC article.
-
Cross-Scale Integrin Regulation Organizes ECM and Tissue Topology.Dev Cell. 2015 Jul 6;34(1):33-44. doi: 10.1016/j.devcel.2015.05.005. Epub 2015 Jun 18. Dev Cell. 2015. PMID: 26096733 Free PMC article.
-
Drug-induced activation of integrin alpha IIb beta 3 leads to minor localized structural changes.PLoS One. 2019 Apr 12;14(4):e0214969. doi: 10.1371/journal.pone.0214969. eCollection 2019. PLoS One. 2019. PMID: 30978226 Free PMC article.
References
-
- Shimaoka M, Takagi J, Springer TA. Conformational regulation of integrin structure and function. Annu Rev Biophys Biomol Struct. 2002;31:485–516. - PubMed
-
- Hynes RO. Integrins: bidirectional, allosteric signaling machines. Cell. 2002;110:673–687. - PubMed
-
- Miranti CK, Brugge JS. Sensing the environment: a historical perspective on integrin signal transduction. Nat Cell Biol. 2002;4:E83–90. - PubMed
-
- Giancotti F, Ruoslahti E. Integrin signaling. Science. 1999;285:1028–1032. - PubMed
-
- Shattil SJ, Kashiwagi H, Pampori N. Integrin signaling: the platelet paradigm. Blood. 1998;91:2645–2657. - PubMed
Publication types
MeSH terms
Substances
Grants and funding
LinkOut - more resources
Full Text Sources
Other Literature Sources
