

Task-dependent encoding of space and events by striatal neurons is dependent on neural subtype
- PMID: 18406064
- PMCID: PMC4206194
- DOI: 10.1016/j.neuroscience.2008.01.081
Task-dependent encoding of space and events by striatal neurons is dependent on neural subtype
Abstract
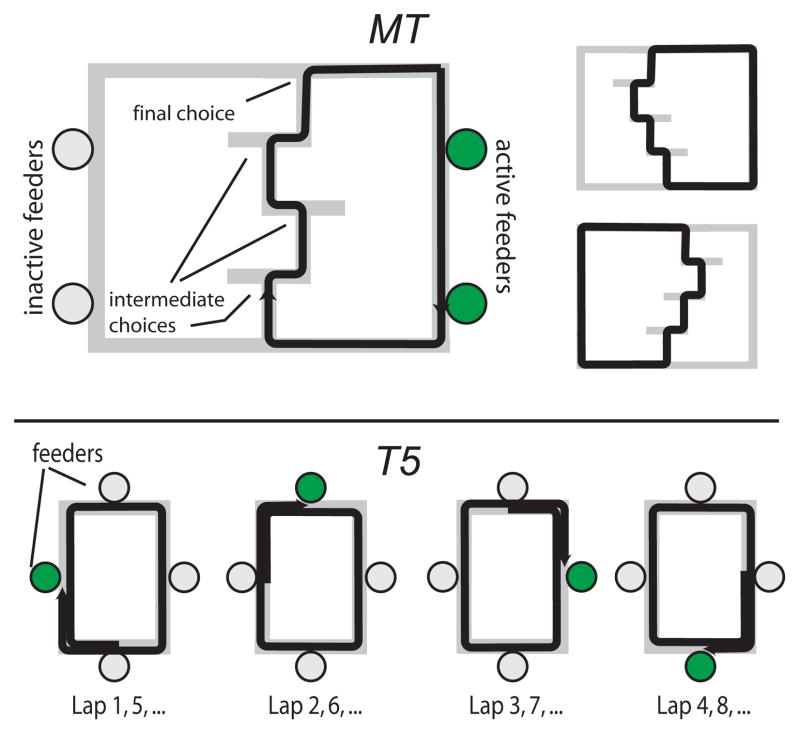
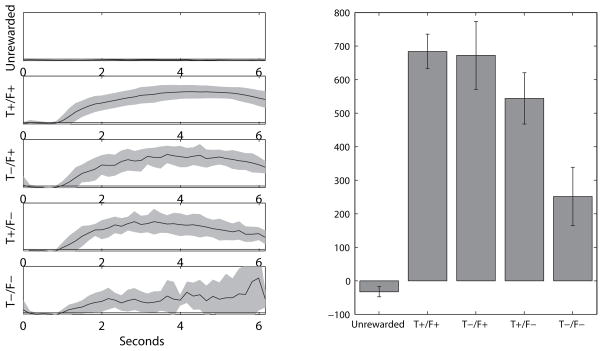
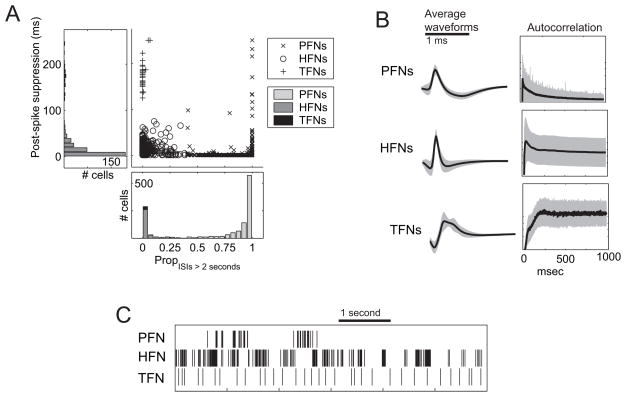
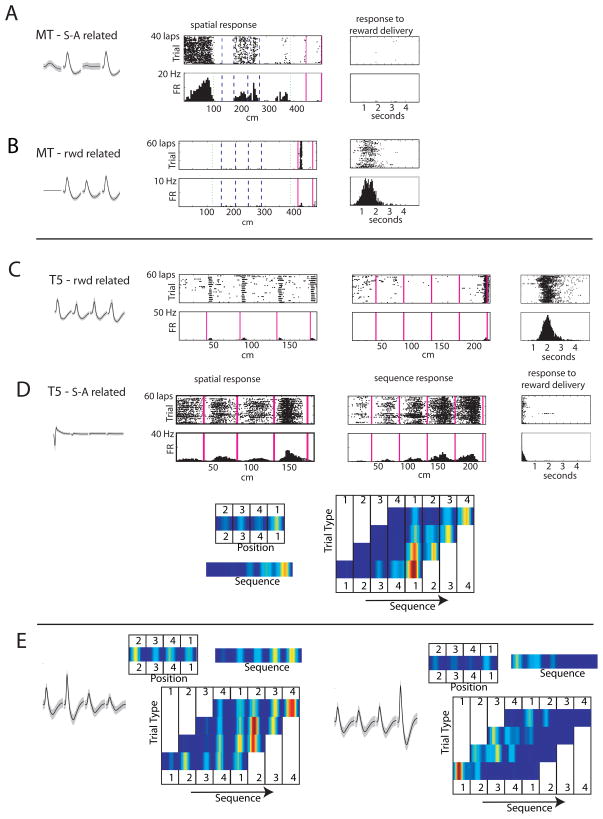
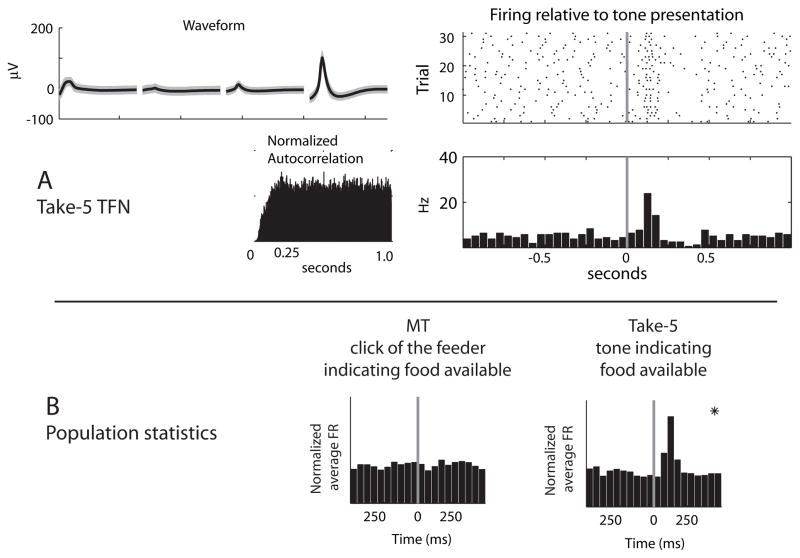
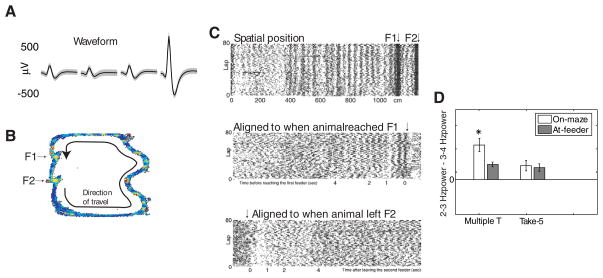
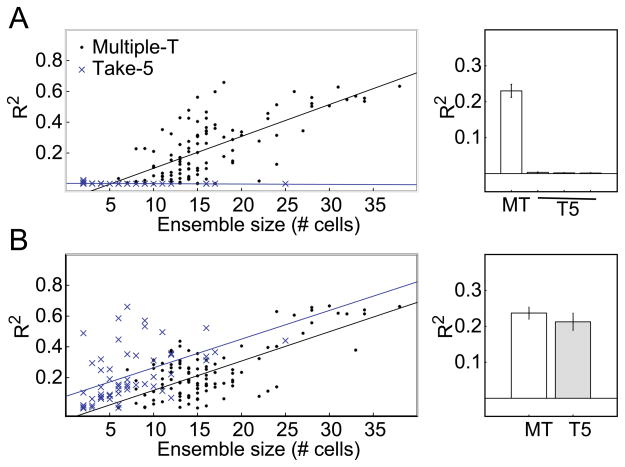
The dorsal striatum plays a critical role in procedural learning and memory. Current models of basal ganglia assume that striatal neurons and circuitry are critical for the execution of overlearned, habitual sequences of action. However, less is known about how the striatum encodes task information that guides the performance of actions in procedural tasks. To explore the striatal encoding of task information, we compared the behavioral correlates of striatal neurons tested in two tasks: a multiple T-maze task in which reward delivery was entirely predictable based on spatial cues (the Multiple-T task), and a task in which rats ran on a rectangular track, but food delivery depended on the distance traveled on the track and was not dependent solely on spatial location (the Take-5 task). Striatal cells recorded on these tasks were divisible into three cell types: phasic-firing neurons (PFNs), tonically firing neurons (TFNs), and high-firing neurons (HFNs) and similar proportions of each cell type were found in each task. However, the behavioral correlates of each cell type were differentially sensitive to the type of task rats were performing. PFNs were responsive to specific task-parameters on each task. TFNs showed reliable burst-and-pause responses following food delivery and other events that were consistent with tonically active neurons (TANs) on the Take-5 (non-spatial) task but not on the Multiple-T (spatial) task. HFNs showed spatial oscillations on the Multiple-T (spatial) task but not the Take-5 (non-spatial) task. Reconstruction of the rats' position on the maze was highly accurate when using striatal ensembles recorded on the Multiple-T (spatial) task, but not when using ensembles recorded on the Take-5 (non-spatial) task. In contrast, reconstruction of time following food delivery was successful in both tasks. The results indicated a strong task dependency of the quality of the spatial, but not the reward-related, striatal representations on these tasks. These results suggest that striatal spatial representations depend on the degree to which spatial task-parameters can be unambiguously associated with goals.
Figures
Similar articles
-
Neuronal activity in the rodent dorsal striatum in sequential navigation: separation of spatial and reward responses on the multiple T task.J Neurophysiol. 2004 May;91(5):2259-72. doi: 10.1152/jn.00687.2003. Epub 2004 Jan 21. J Neurophysiol. 2004. PMID: 14736863
-
Parallel processing across neural systems: implications for a multiple memory system hypothesis.Neurobiol Learn Mem. 2004 Nov;82(3):278-98. doi: 10.1016/j.nlm.2004.07.007. Neurobiol Learn Mem. 2004. PMID: 15464410 Review.
-
Striatal versus hippocampal representations during win-stay maze performance.J Neurophysiol. 2009 Mar;101(3):1575-87. doi: 10.1152/jn.91106.2008. Epub 2009 Jan 14. J Neurophysiol. 2009. PMID: 19144741 Free PMC article.
-
Memory influences on hippocampal and striatal neural codes: effects of a shift between task rules.Neurobiol Learn Mem. 2007 May;87(4):495-509. doi: 10.1016/j.nlm.2006.09.008. Epub 2007 Jan 19. Neurobiol Learn Mem. 2007. PMID: 17240173 Free PMC article.
-
Involvement of basal ganglia and orbitofrontal cortex in goal-directed behavior.Prog Brain Res. 2000;126:193-215. doi: 10.1016/S0079-6123(00)26015-9. Prog Brain Res. 2000. PMID: 11105648 Review.
Cited by
-
Computational validity: using computation to translate behaviours across species.Philos Trans R Soc Lond B Biol Sci. 2022 Feb 14;377(1844):20200525. doi: 10.1098/rstb.2020.0525. Epub 2021 Dec 27. Philos Trans R Soc Lond B Biol Sci. 2022. PMID: 34957854 Free PMC article.
-
Putative cholinergic interneurons in the ventral and dorsal regions of the striatum have distinct roles in a two choice alternative association task.Front Syst Neurosci. 2011 May 31;5:36. doi: 10.3389/fnsys.2011.00036. eCollection 2011. Front Syst Neurosci. 2011. PMID: 21660109 Free PMC article.
-
Interactions of spatial strategies producing generalization gradient and blocking: A computational approach.PLoS Comput Biol. 2018 Apr 9;14(4):e1006092. doi: 10.1371/journal.pcbi.1006092. eCollection 2018 Apr. PLoS Comput Biol. 2018. PMID: 29630600 Free PMC article.
-
Parvalbumin Interneurons Modulate Striatal Output and Enhance Performance during Associative Learning.Neuron. 2017 Mar 22;93(6):1451-1463.e4. doi: 10.1016/j.neuron.2017.02.033. Neuron. 2017. PMID: 28334608 Free PMC article.
-
Striatal activity topographically reflects cortical activity.Nature. 2021 Mar;591(7850):420-425. doi: 10.1038/s41586-020-03166-8. Epub 2021 Jan 20. Nature. 2021. PMID: 33473213 Free PMC article.
References
-
- Alexander GE, DeLong MR. Microstimulation of the primate neostriatum. II. Somatotopic organization of striatal microexcitable zones and their relation to neuronal response properties. Journal of Neurophysiology. 1985;53(6):1417–1430. - PubMed
-
- Aosaki T, Graybiel AM, et al. Effect of the nigrostriatal dopamine system on acquired neural responses in the striatum of behaving monkeys. Science. 1994;265(5170):412–5. - PubMed
-
- Aosaki T, Kimura M, et al. Temporal and spatial characteristics of tonically active neurons of the primate’s striatum. J Neurophysiol. 1995;73(3):1234–52. - PubMed
MeSH terms
Grants and funding
LinkOut - more resources
Full Text Sources
Miscellaneous
