. 2008 Apr 11;30(1):11-25.
doi: 10.1016/j.molcel.2008.02.012.

Quantitative analysis of pathways controlling extrinsic apoptosis in single cells

Affiliations

Quantitative analysis of pathways controlling extrinsic apoptosis in single cells

John G Albeck et al. Mol Cell. .

Abstract

Apoptosis in response to TRAIL or TNF requires the activation of initiator caspases, which then activate the effector caspases that dismantle cells and cause death. However, little is known about the dynamics and regulatory logic linking initiators and effectors. Using a combination of live-cell reporters, flow cytometry, and immunoblotting, we find that initiator caspases are active during the long and variable delay that precedes mitochondrial outer membrane permeabilization (MOMP) and effector caspase activation. When combined with a mathematical model of core apoptosis pathways, experimental perturbation of regulatory links between initiator and effector caspases reveals that XIAP and proteasome-dependent degradation of effector caspases are important in restraining activity during the pre-MOMP delay. We identify conditions in which restraint is impaired, creating a physiologically indeterminate state of partial cell death with the potential to generate genomic instability. Together, these findings provide a quantitative picture of caspase regulatory networks and their failure modes.


Figures
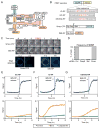
Figure 1
Figure 1
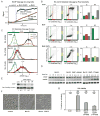
Live-cell reporters for monitoring extrinsic cell death. In all cases, cells were treated with 50 ng/ml TRAIL+2.5 μg/ml CHX. A,B. Schematic diagram of TRAIL-induced apoptotic pathways and reporter proteins. Abbreviations: ECFP - enhanced cyan fluorescent protein; Venus - venus yellow fluorescent protein; Sig. seq.- mitochondrial import signal sequence; IBM - IAP-binding motif; mRFP – monomeric red fluorescent protein. C. Kinetics of IMS-RP and Smac-CFP release from mitochondria. Top: Images from an individual cell expressing both IMS-RP and Smac-CFP and treated with TRAIL+CHX, at 3 min intervals. Time is relative to the first frame in which IMS-RP and Smac-CFP translocation was visible (t=0, pink bar). Bottom: Comparison of IMS-RP and Smac-CFP localization immediately preceding (t=-3 min) and following (t=0 min) MOMP using an edge detection filter (see Materials and Methods). D. Percentage of cells exhibiting IMS-RP release when transfected with control, Bid, caspase-8, or Smac siRNAs and treated for 12 hours with TRAIL+CHX. E,F,G. Timecourses of cleavage for EC-RP (E), IC-RP (F), or DEVDG-RP (G) imaged in single siRNA-transfected cells treated with TRAIL+CHX. In cells treated with control siRNA, vertical lines indicate the time of IMS-RP release; release did not occur in the Bid- and caspase-8-depleted cells.
Figure 2
Figure 2
A composite picture of effector and initiator caspases in single cells. A, B. Timecourses of cells expressing IMS-RP and either EC-RP (A), or IC-RP (B), treated with 50 ng/ml TRAIL and 2.5 μg/ml CHX. Fifty individual cells are shown for each reporter (grey lines), with three cells exhibiting early, late, or intermediate times of death highlighted in red, blue, and green; vertical bars indicate the time of IMS-RP release for each highlighted cell. C, D. EC-RP (C) or IC-RP (D) timecourses from 50 single cells (in gray), aligned by IMS-RP release in each cell (red vertical line). Averaged signals for each reporter are shown as colored circles. E, F. Composite graphs of live-cell data for HeLa cells treated with 50 ng/mL TRAIL with (E) or without (F) 2.5 μg/ml CHX. For each treatment condition, average IC-RP (green) and EC-RP (blue) signals from >40 cells were aligned by IMS-RP release (red vertical line). Error bars indicate one standard deviation from the mean.
Figure 3
Figure 3
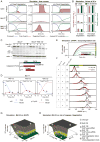
Input-output relationship between initiator and effector caspases. A. Flow cytometric detection of cleaved PARP (EC substrate) and cleaved caspase-3 (IC substrate) in HeLa cells treated with 10 ng/ml TRAIL and 2.5 μg/ml CHX. Single-parameter histograms derived from each 2-dimensional plot are shown above or to the right of the corresponding axes with colors denoting low (0-5%), intermediate (5-25%), and high (25-100%) staining. Vertical lines denote thresholds of IC substrate cleavage as follows: green – median IC substrate signal in untreated cells; grey – median IC substrate signal in apoptotic cells; red – threshold IC substrate level for transition from low to high EC substrate cleavage. B. Fraction of cells exhibiting low, intermediate, and high IC or EC substrate cleavage for the time course shown in (A) with identical color-coding. C. Plot of input-output relationships between initiator and effector caspases derived from the live-cell data of Fig 2E and F. IC-RP and EC-RP signals at each time point are plotted directly against each other for cells treated with TRAIL in the presence (blue) or absence (red) of CHX; IMS-RP release is indicated by vertical lines. D. Schematic illustration of the sequence of initiator caspase (IC) and effector caspase (EC) substrate cleavage with circles denoting sequential states of the cell in response to TRAIL, and arrows indicating the transition to the next state (with longer arrows indicating more rapid transitions). Circles are colored by the discretized level of EC substrate cleavage (corresponding to the colored bars on the vertical axis), with red dots indicating cells in which MOMP has occurred. Vertical lines denote the level of IC substrate cleavage in the initial state (green), final state (grey), and at the time of MOMP induction (red). E, F. Immunoblot detection of PARP, caspase-3, or caspase-8 processing for control or Bcl-2-overexpressing HeLa cells transfected with non-targeting siRNAs and treated with 50 ng/ml TRAIL + 2.5 μg/ml CHX for the indicated times.
Figure 4
Figure 4
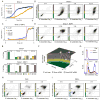
Breakdown of all-or-none caspase activation. In all cases, TRAIL was used at 50 ng/ml and CHX at 2.5 μg/ml. A. Timecourses of EC-RP cleavage in single HeLa cells transfected with non-targeting (blue), Bid (green), or Bid plus XIAP (orange) siRNAs and treated with TRAIL+CHX. B. Flow cytometric detection of EC substrate (PARP) or IC substrate (caspase-3) cleavage in HeLa cells transfected with non-targeting, Bid, or Bid + XIAP siRNA oligos, and treated with TRAIL+CHX. Plots are annotated as in Fig 3; bar graphs show the percentage of cells with low, medium, or high EC or IC substrate cleavage at 3 hours. C. Flow cytometric analysis of EC substrate cleavage in control and Bcl-2-overexpressing HeLa cells transfected with control or XIAP-targeting siRNAs and treated with TRAIL+CHX. Low, medium, and high PARP cleavage are indicated by colored bars, with dotted lines indicating the median fluorescence intensity of cleaved PARP at 4.5 hours; percentages are relative to control HeLa cells (set at 100%). D. Immunoblot detection of PARP cleavage for Bcl-2 overexpressing cells depleted 8- or 17-fold for XIAP using either of two siRNA oligos and treated with TRAIL+CHX. Results are representative of three independent experiments. E. Immunoblot quantitation of XIAP depletion by siRNA. HeLa cells were transfected with control or four different XIAP-targeting siRNA oligos for 48 hours and analyzed by immunoblot. Fold depletion of XIAP (relative to control oligo) is shown below each lane. F. Phase-contrast images of control or Bcl-2-overexpressing HeLa cells transfected with control or XIAP-targeting siRNA oligos, and treated for 4.5 hours with TRAIL+CHX (conditions identical to those used in Fig 4C-D). G. Quantification of colony-formation following TRAIL treatment. Control or Bcl-2 overexpressing cells were transfected with control or XIAP-targeting siRNA oligos. Fractions indicate the number of colonies formed after treatment with TRAIL+CHX (numerator), or with CHX alone (denominator); bars indicate the percentage of colonies formed under TRAIL+CHX conditions normalized by the number formed under CHX alone. Results are representative of two independent experiments.
Figure 5
Figure 5
Mechanism of partial caspase-3 substrate cleavage. A. Simulation of time evolution of procaspase-3, free (non-XIAP-bound) caspase-3, degraded caspase-3, and cleaved EC substrate for the indicated conditions; simulations are shown at full scale (first column) and at magnified scale to highlight low-abundance species (second column). The third column shows the same simulations performed in the absence caspase-3 degradation. The area under the curve of free (non-XIAP-bound) caspase-3 is shaded pink to indicate the integrated total amount of caspase-3 activity in each condition. B. Correspondence of EC pulse size and steady state EC substrate cleavage. For simulations of the conditions in (A), the integrated value of free active caspase-3 (maroon; shown on a log10 scale) and the final level of EC substrate cleavage (yellow) are shown for a period of 24 hours (to allow all species to reach steady state). C. Immunoblot with an anti-caspase-3 antibody in control cells treated with 50 ng/ml TRAIL+2.5 μg/ml CHX in the presence or absence of 10 μM MG-132. The diagram below the blot depicts the processing of the 32 kDa procaspase-3 to the active 20 kDa and 17 kDa forms of; all three of these polypeptides are detected by the antibody used for the immunoblot (indicated by arrows). Single asterisks indicate non-specific bands; double asterisk indicates a band whose identity is uncertain but whose size is consistent with monoubiquitinated caspase-3 p17. D. Estimation of cleaved caspase-3 stability. A simplified kinetic model was fit to quantitated immunoblot values in (C); see supplementary materials. E. Simulation of PARP cleavage in Bcl-2-overexpressing cells with varying levels of XIAP-mediated caspase-3 degradation. F. Flow cytometric quantitation of cleaved EC substrate (PARP) in Bcl-2-overexpressing or control cells pre-treated with varying concentrations of MG-132 and treated with 50 ng/ml TRAIL as indicated; all conditions included 2.5 μg/ml CHX. Vertical lines and percentages indicate the median EC substrate cleavage at 4.5 hours, relative to the level observed in control HeLa cells. G, H. Simulation of steady-state EC substrate cleavage as a function of Bcl-2 and XIAP levels ([Bcl-2]0 and [XIAP]0, G), or as a function of [Bcl-2]0 and the rate of caspase-3 degradation by XIAP (H). The height and color of the surface indicate the steady-state level of EC substrate cleavage for an idealized cell in response to TRAIL treatment; numbered circles correspond to the indicated experimental conditions. Red arrows show regions where partial EC substrate cleavage is induced by varying [XIAP]0 (G) or rate of caspase-3 degradation (H).
Figure 6
Figure 6
Importance of the Smac:XIAP ratio for rapid EC substrate cleavage. In all cases, TRAIL was used at 50 ng/ml and CHX at 2.5 μg/ml. A. Composite graph of single-cell initiator and effector caspase activity in Smac-depleted cells treated with TRAIL+CHX. Curves for EC-RP and IC-RP were assembled as in Fig. 2 for n>50 cells with each reporter. B. Flow cytometry of cleaved EC substrate (PARP) and cleaved IC substrate (caspase-3) in Smac-depleted cells treated with TRAIL+CHX. C. Composite graph of IC-RP and EC-RP signals in Smac- and XIAP-depleted cells treated as in (A). D. Flow cytometry analysis of Smac- and XIAP- depleted cells, as in (B). E. Fraction of cells exhibiting low, intermediate, and high EC substrate cleavage for the time courses shown in (B) and (D). F. Simulation of steady-state EC substrate cleavage as a function of initial expression levels of XIAP and Smac. Orange dotted line indicates the region where the initial concentrations of Smac and XIAP are equal. G. Flow cytometry of cleaved EC substrate (PARP) and cleaved IC substrate (caspase-3) in control and XIAP-depleted cells treated with TRAIL+CHX. Red and blue arrows indicate the pre-MOMP populations in control and XIAP-depleted conditions, respectively. H. Comparison of cPARP levels in the pre-MOMP populations of control and XIAP-depleted cells. Arrows indicate the median cPARP levels for the pre-MOMP populations at 2 hr, which are different with p<0.01 by the Komolgorov-Smirnov test (asterisk). The difference between the pre-MOMP populations for the two experimental conditions is highlighted in yellow.
Figure 7
Figure 7
Constraints on XIAP for effective caspase-3 switching. A. Schematic diagrams depicting the progression of caspase network states in perturbed and unperturbed cells following TRAIL+CHX treatment. Diagrams are drawn according to the conventions in Fig. 3C. The expected cell fate is depicted at the end of each progression as indicated in the legend. B. Graphical depiction of response to TRAIL stimulation in selected cell states, with numbering as in A. C-D. Simulation of EC substrate cleavage in MOMP-inhibited cells as a function of initial XIAP concentration (horizontal axis) and the rate of caspase-3 degradation (vertical axis). Blue color in (C) indicates level of EC substrate cleavage at 6 hr, and the yellow dotted line denotes the region where the simulated cleavage level satisfies the experimentally observed constraint of <5%. Red color in (D) indicates level of EC substrate cleavage at 6 hr, and the green dotted line denotes the region where the simulated cleavage level satisfies the experimentally observed level of >90%. E. Superposition of (C) and (D). Region bounded by yellow and green dotted lines encompasses parameter values that satisfy the constraints of both (C) and (D). Matlab scripts for each simulation are available as a Supplementary file.

References

    1. Betti CJ, Villalobos MJ, Jiang Q, Cline E, Diaz MO, Loredo G, Vaughan AT. Cleavage of the MLL gene by activators of apoptosis is independent of topoisomerase II activity. Leukemia. 2005;19:2289–2295. - PubMed
    1. Boatright KM, Renatus M, Scott FL, Sperandio S, Shin H, Pedersen IM, Ricci JE, Edris WA, Sutherlin DP, Green DR, Salvesen GS. A unified model for apical caspase activation. Mol Cell. 2003;11:529–541. - PubMed
    1. Bose K, Pop C, Feeney B, Clark AC. An uncleavable procaspase-3 mutant has a lower catalytic efficiency but an active site similar to that of mature caspase-3. Biochemistry. 2003;42:12298–12310. - PMC - PubMed
    1. Bratton SB, Cohen GM. Death receptors leave a caspase footprint that Smacs of XIAP. Cell Death Differ. 2003;10:4–6. - PubMed
    1. Chen L, Smith L, Wang Z, Smith JB. Preservation of caspase-3 subunits from degradation contributes to apoptosis evoked by lactacystin: any single lysine or lysine pair of the small subunit is sufficient for ubiquitination. Mol Pharmacol. 2003;64:334–345. - PubMed

Publication types

MeSH terms

Substances