. 2008 May 15;80(10):3699-707.
doi: 10.1021/ac800112r. Epub 2008 Apr 11.

Simple telemedicine for developing regions: camera phones and paper-based microfluidic devices for real-time, off-site diagnosis

Affiliations

Simple telemedicine for developing regions: camera phones and paper-based microfluidic devices for real-time, off-site diagnosis

Andres W Martinez et al. Anal Chem. .

Abstract

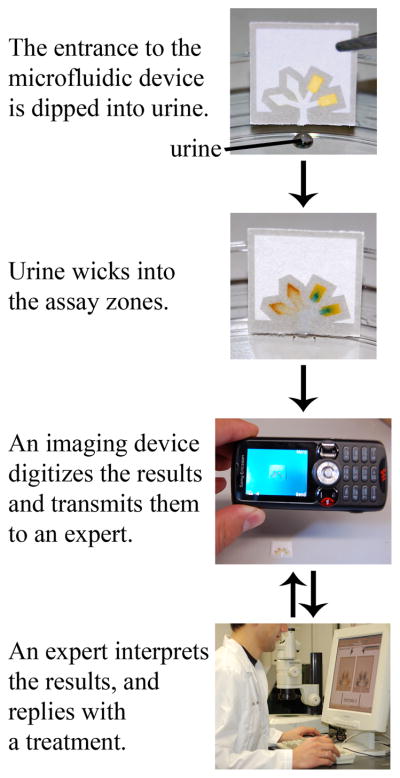
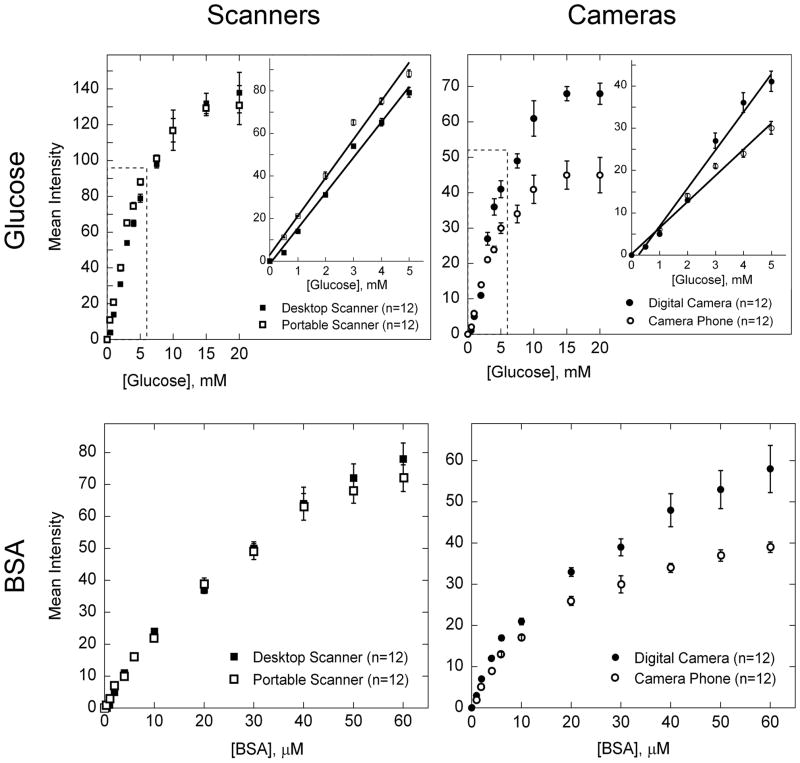
This article describes a prototype system for quantifying bioassays and for exchanging the results of the assays digitally with physicians located off-site. The system uses paper-based microfluidic devices for running multiple assays simultaneously, camera phones or portable scanners for digitizing the intensity of color associated with each colorimetric assay, and established communications infrastructure for transferring the digital information from the assay site to an off-site laboratory for analysis by a trained medical professional; the diagnosis then can be returned directly to the healthcare provider in the field. The microfluidic devices were fabricated in paper using photolithography and were functionalized with reagents for colorimetric assays. The results of the assays were quantified by comparing the intensities of the color developed in each assay with those of calibration curves. An example of this system quantified clinically relevant concentrations of glucose and protein in artificial urine. The combination of patterned paper, a portable method for obtaining digital images, and a method for exchanging results of the assays with off-site diagnosticians offers new opportunities for inexpensive monitoring of health, especially in situations that require physicians to travel to patients (e.g., in the developing world, in emergency management, and during field operations by the military) to obtain diagnostic information that might be obtained more effectively by less valuable personnel.


Figures

Figure 1
Figure 1
General strategy for performing inexpensive bioassays in remote locations and for exchanging the results of the tests with off-site technicians.
Figure 2
Figure 2
Design of a prototype paper-based microfluidic device that quantifies two analytes in urine simultaneously. The central channel at the bottom of the device wicks the sample into the four separate test zones; independent assays occur in each zone. The glucose assay occurs in the diamond-shaped test zones, where reagent mobility and evaporation concentrate the reagents in the tip. The protein assay occurs in the rectangular test zones. The blank area above the channels can be used for labeling or for manipulating the device. The hydrophobic lines (pictured in gray) are 1-mm wide, but can be made as small as 250 μm with retention of function. The entire device fits on a 1.5 cm × 1.5 cm piece of chromatography paper. The thick, 2-mm tall hydrophobic line across the bottom of the device blocks the urine from entering the unused, hydrophilic region of the paper. The dashed lines indicate the edges of the paper device.
Figure 3
Figure 3
Schematic of the method for fabricating paper-based microfluidic devices. (a) Procedure for patterning paper with hydrophobic photoresist. (b) Derivatization of the device for assays.
Figure 4
Figure 4
A 10-μM solution of FITC-BSA dissolved in 40-mM phosphate buffer (pH 7.4) was wicked into the paper-based device and imaged under UV light (254 nm). The FITC-BSA distributes evenly throughout the channels and test zones. a) A device before wicking a solution containing FITC-BSA. b) A device after wicking 1 μL of the FITC-BSA solution. c) A device after wicking 2 μL of the FITC-BSA solution. d) A device after wicking 5 μL of the FITC-BSA solution.
Figure 5
Figure 5
Procedure for quantifying the levels of glucose and protein in urine using image editing software (we used Adobe®Photoshop®). For the glucose assay, we converted the scanned or photographed digital images to 8-bit grayscale and selected the appropriate test zone of the device. For the protein assay, we converted the image to CMYK color and measured the intensity of cyan. The mean pixel values within the test zones correlate with the concentration of the analyte.
Figure 6
Figure 6
Analytical calibration plots for different concentrations of glucose and protein in artificial urine. The mean intensity for each data point was obtained from the histogram in Adobe®Photoshop®, as described in Figure 4. We measured concentrations of glucose between 0 and 20 mM. The protein assay was run using concentrations of BSA between 0 and 60 μM. The graphs contain data obtained using a desktop scanner (■), a portable scanner (□), a digital camera (●), and a camera phone with automatic focus (○); the inset shows the linear region of the data in greater detail. Each datum is the mean of twelve assays; error bars represent the relative standard deviations of these measurements. For the glucose assay, the linear region of the data was fit with a line (shown in the inset); the slope (m), intercept (b), and R2 value for each line are as follows: desktop scanner (m = 16.6, b = −1.54, R2 = 0.991), portable scanner (m = 18.0, b = 2.95, R2 = 0.986), digital camera (m = 8.96, b = −2.12, R2 = 0.983), and camera phone (m = 6.17, b = 0.186, R2 = 0.986). The protein data was fit with a quadratic equation; the quadratic coefficient (a), the linear coefficient (b), the constant coefficient (c), and the R2 value for each curve are as follows: desktop scanner (a = −0.015, b = 2.15, c = 0.955, R2 = 0.996), portable scanner (a = −0.017, b = 2.20, c = 1.36, R2 = 0.998), digital camera (a = −0.012, b = 1.62, c = 3.81, R2 = 0.987), and camera phone (a = −0.012, b = 1.29, c = 3.36, R2 = 0.986).
Figure 7
Figure 7
Devices run with 5 μL of contaminated samples of glucose and protein (4.5 mM glucose and 50 μM BSA). The solid contaminants (A) sawdust, (B) plant, and (C) dirt are filtered from the samples and do not interfere with the assays, except in the case of the protein assay that is contaminated by the plant.
Figure 8
Figure 8
Stability of the glucose assays over time. In the presence of trehalose, the intensity of signal for the glucose assay (when detecting 5-mM glucose in artificial urine) was constant for 30 days when the devices were stored at room temperature; after 30 days the signal decayed at a rate of 0.6 intensity units per day. When devices were stored without trehalose, the signal immediately decreased linearly over time. The protein assay can be stored at room temperature for over two months without significant loss of signal (data not shown). The values on the graph are the average of six measurements, and the error bars represent the confidence level for the true mean at a 95% confidence level using a t-distribution. The mean intensity for each datum was obtained from the histogram in Adobe®Photoshop®, as described in Figure 4.

Similar articles

Cited by

References

    1. Daar AS, Thorsteinsdóttir H, Martin DK, Smith AC, Nast S, Singer PA. Nat Genet. 2002;32:229–232. - PubMed
    1. Mabey D, Peeling RW, Ustianowski A, Perkins MD. Nat Rev Microbiol. 2004;2:231–240. - PubMed
    1. Braun RP, Vecchietti JL, Thomas L, Prins C, French LE, Gewirtzman AJ, Saurat JH, Salomon D. Arch Dermatol. 2005;141:254–258. - PubMed
    1. Dziadzio M, Hamdulay S, Reddy V, Boyce S, Keat A, Andrews J. Clin Rheumatol. 2007;26:979–980. - PubMed
    1. Kaplan WA. Global Health. 2006;2:9. - PMC - PubMed

Publication types