

Low-frequency dynamics of Caldariomyces fumago chloroperoxidase probed by femtosecond coherence spectroscopy
- PMID: 18407660
- PMCID: PMC2766418
- DOI: 10.1021/bi7025485
Low-frequency dynamics of Caldariomyces fumago chloroperoxidase probed by femtosecond coherence spectroscopy
Erratum in
- Biochemistry. 2008 Sep 2;47(35):9344
Abstract
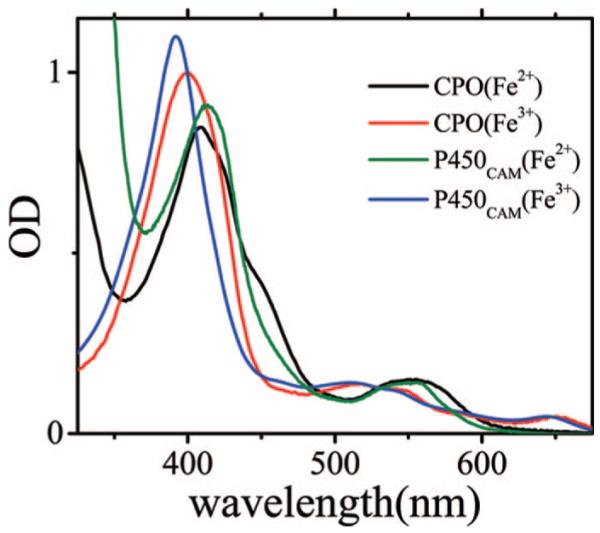
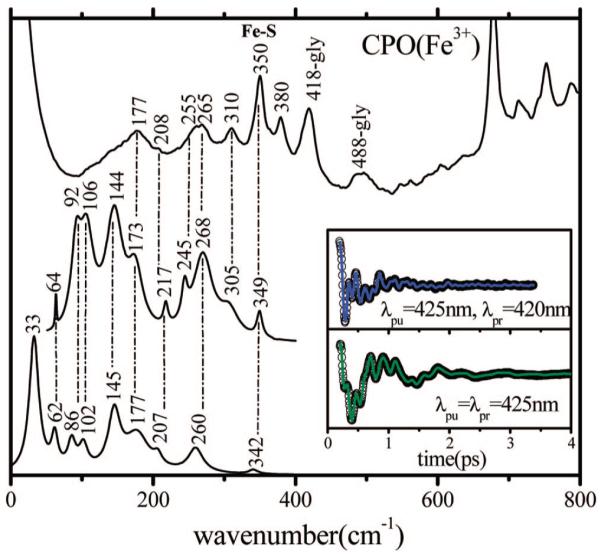
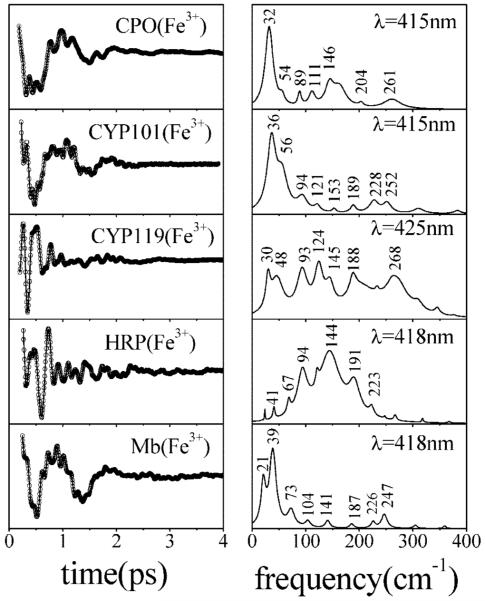
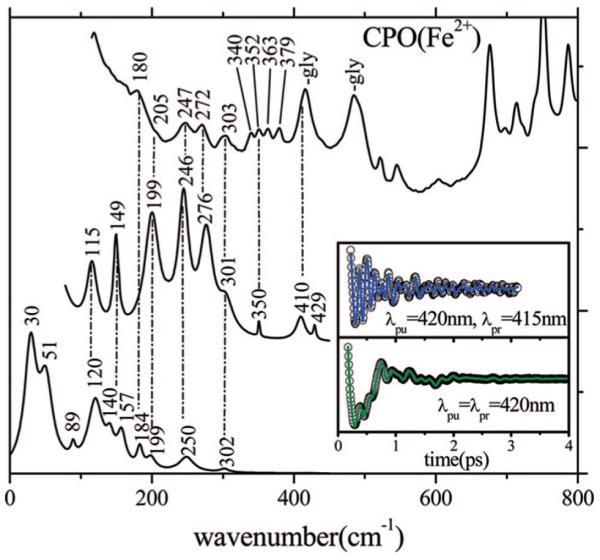
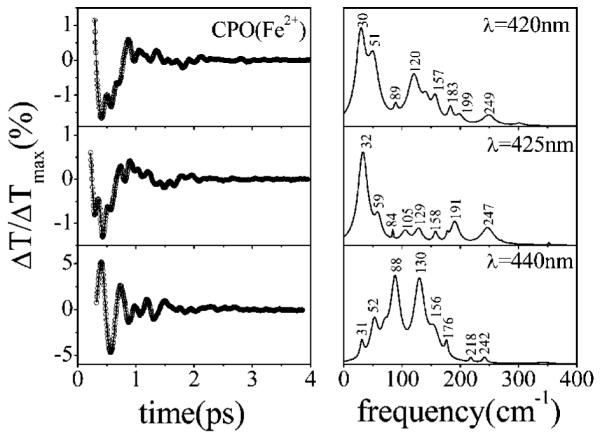
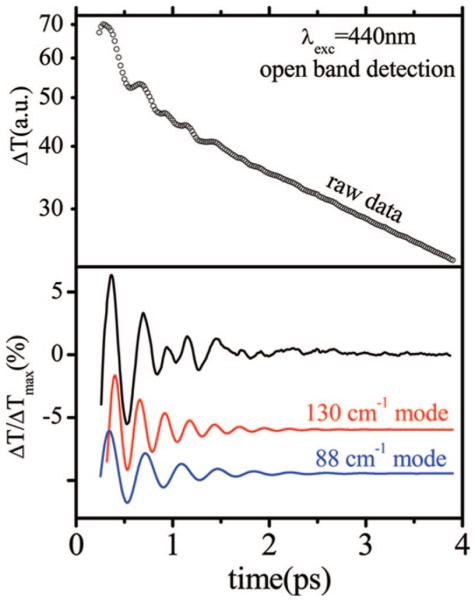
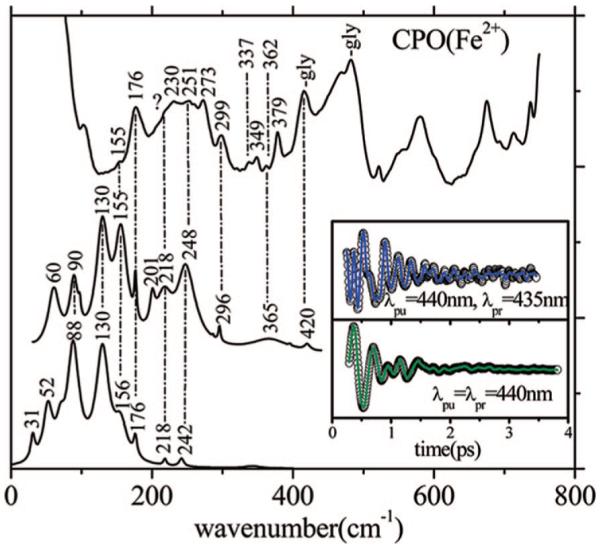
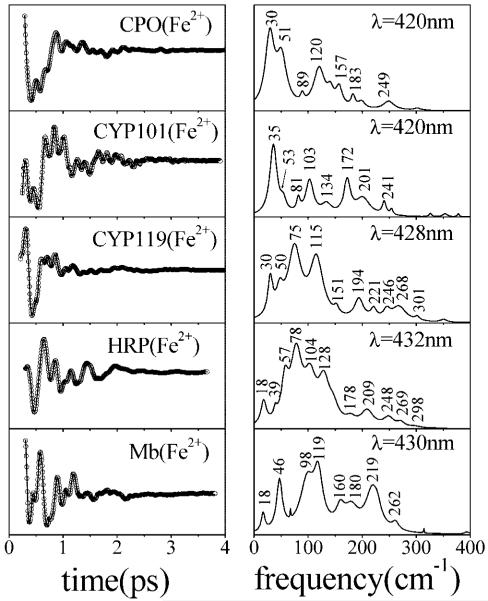
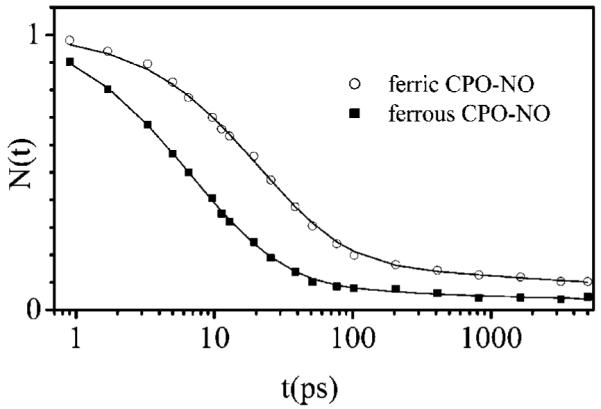
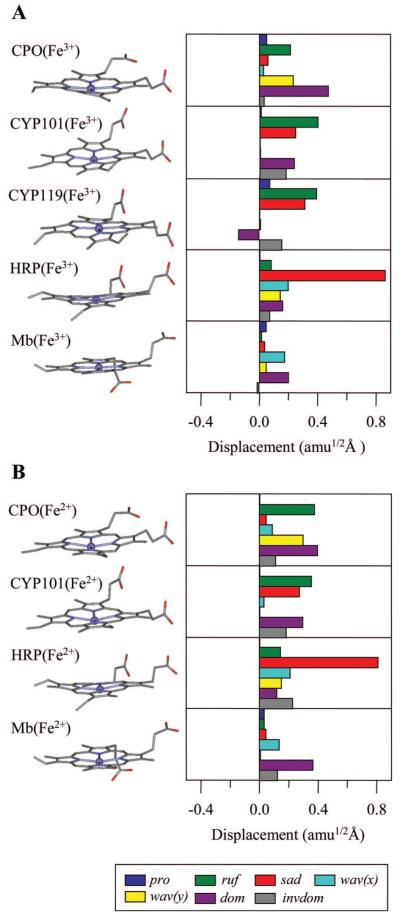
Ultrafast laser spectroscopy techniques are used to measure the low-frequency vibrational coherence spectra and nitric oxide rebinding kinetics of Caldariomyces fumago chloroperoxidase (CPO). Comparisons of the CPO coherence spectra with those of other heme species are made to gauge the protein-specific nature of the low-frequency spectra. The coherence spectrum of native CPO is dominated by a mode that appears near 32-33 cm(-1) at all excitation wavelengths, with a phase that is consistent with a ground-state Raman-excited vibrational wavepacket. On the basis of a normal coordinate structural decomposition (NSD) analysis, we assign this feature to the thiolate-bound heme doming mode. Spectral resolution of the probe pulse ("detuned" detection) reveals a mode at 349 cm(-1), which has been previously assigned using Raman spectroscopy to the Fe-S stretching mode of native CPO. The ferrous species displays a larger degree of spectral inhomogeneity than the ferric species, as reflected by multiple shoulders in the optical absorption spectra. The inhomogeneities are revealed by changes in the coherence spectra at different excitation wavelengths. The appearance of a mode close to 220 cm(-1) in the coherence spectrum of reduced CPO excited at 440 nm suggests that a subpopulation of five coordinated histidine-ligated hemes is present in the ferrous state at a physiologically relevant pH. A significant increase in the amplitude of the coherence signal is observed for the resonance with the 440 nm subpopulation. Kinetics measurements reveal that nitric oxide binding to ferric and ferrous CPO can be described as a single-exponential process, with rebinding time constants of 29.4 +/- 1 and 9.3 +/- 1 ps, respectively. This is very similar to results previously reported for nitric oxide binding to horseradish peroxidase.
Figures

Similar articles
-
Resonance Raman spectroscopy of the catalytic intermediates and derivatives of chloroperoxidase from Caldariomyces fumago.J Biol Chem. 1994 May 13;269(19):13966-78. J Biol Chem. 1994. PMID: 8188677
-
Vibrational coherence spectroscopy of the heme domain in the CO-sensing transcriptional activator CooA.J Am Chem Soc. 2011 Nov 23;133(46):18816-27. doi: 10.1021/ja206152m. Epub 2011 Oct 28. J Am Chem Soc. 2011. PMID: 21961804 Free PMC article.
-
Heme active-site structural characterization of chloroperoxidase by resonance Raman spectroscopy.J Biol Chem. 1993 Mar 25;268(9):6189-93. J Biol Chem. 1993. PMID: 8384203
-
Heme-thiolate haloperoxidases: versatile biocatalysts with biotechnological and environmental significance.Appl Microbiol Biotechnol. 2006 Jul;71(3):276-88. doi: 10.1007/s00253-006-0417-3. Appl Microbiol Biotechnol. 2006. PMID: 16628447 Review.
-
Synthetic active site analogues of heme-thiolate proteins. Characterization and identification of intermediates of the catalytic cycles of cytochrome P450cam and chloroperoxidase.J Inorg Biochem. 2001 Feb;83(4):289-300. doi: 10.1016/s0162-0134(00)00175-6. J Inorg Biochem. 2001. PMID: 11293549 Review.
Cited by
-
How the Proximal Pocket May Influence the Enantiospecificities of Chloroperoxidase-Catalyzed Epoxidations of Olefins.Int J Mol Sci. 2016 Aug 9;17(8):1297. doi: 10.3390/ijms17081297. Int J Mol Sci. 2016. PMID: 27517911 Free PMC article.
-
Investigations of heme ligation and ligand switching in cytochromes p450 and p420.Biochemistry. 2013 Aug 27;52(34):5941-51. doi: 10.1021/bi400541v. Epub 2013 Aug 14. Biochemistry. 2013. PMID: 23905516 Free PMC article.
-
Investigations of the low-frequency spectral density of cytochrome c upon equilibrium unfolding.J Phys Chem B. 2013 Aug 22;117(33):9615-25. doi: 10.1021/jp404881k. Epub 2013 Aug 7. J Phys Chem B. 2013. PMID: 23863217 Free PMC article.
-
Investigation of the low frequency dynamics of heme proteins: native and mutant cytochrome P450(cam) and redox partner complexes.J Phys Chem B. 2011 May 12;115(18):5665-77. doi: 10.1021/jp112298y. Epub 2011 Mar 10. J Phys Chem B. 2011. PMID: 21391540 Free PMC article.
-
Investigations of low-frequency vibrational dynamics and ligand binding kinetics of cystathionine beta-synthase.J Phys Chem B. 2010 Mar 11;114(9):3294-306. doi: 10.1021/jp909700r. J Phys Chem B. 2010. PMID: 20155941 Free PMC article.
References
-
- Hollenberg PF, Hager LP. Purification of chloroperoxidase from Caldariomyces fumago. Methods Enzymol. 1978;52:521–529. - PubMed
-
- Andersson LA, Dawson JH. EXAFS spectroscopy of heme-containing oxygenases and peroxidases. Struct. Bonding. 1991;64:1–40.
-
- Dawson JH. Probing structure-function relations in heme-containing oxygenases and peroxidases. Science. 1988;240:433–439. - PubMed
-
- Griffin BW. Chloroperoxidase: A Review. CRC Press; Boca Raton, FL: 1991.
-
- Morrison M, Schonbaum GR. Peroxidase-catalyzed halogenation. Annu. Rev. Biochem. 1976;45:861–888. - PubMed
Publication types
MeSH terms
Substances
Grants and funding
LinkOut - more resources
Full Text Sources
Miscellaneous
