Adeno-sh-beta-catenin abolishes ischemic preconditioning-mediated cardioprotection by downregulation of its target genes VEGF, Bcl-2, and survivin in ischemic rat myocardium
- PMID: 18407748
- PMCID: PMC2932533
- DOI: 10.1089/ars.2008.2042
Adeno-sh-beta-catenin abolishes ischemic preconditioning-mediated cardioprotection by downregulation of its target genes VEGF, Bcl-2, and survivin in ischemic rat myocardium
Abstract
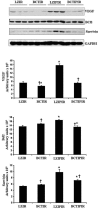
beta-Catenin, the downstream target of glycogen synthase kinase-3beta (GSK-3beta), plays a vital role in ischemic preconditioning (IP)-mediated cardioprotection. In the present study, we investigated the mechanism of IP-mediated cardioprotection through suppression of beta-catenin expression by intramyocardial injection of adeno-sh-RNA against beta-catenin (BCT) (4 x 10(8) pfu). Adeno-LacZ (LZ) was used as control. The rats were randomized into (a) LZ + ischemia-reperfusion (IR); (b) LZIPIR; (c) BCTIR; and (d) BCTIPIR. Isolated hearts from each group were subjected to 30 min of I followed by 2 h of R. Both IPIR group hearts were subjected to IP (5 min I + 10 min R; four cycles) before IR. Significant reduction in left ventricular functional recovery (78 vs. 88 mm Hg), dp/dt(max) (1,802 vs. 2,189 mm Hg/sec), and aortic flow (4 vs. 9 ml/min) was observed in BCTIPIR compared with LZIPIR at 120 min of reperfusion. Increased infarct size (42 vs. 24%) and apoptotic cardiomyocytes (122 vs. 58 counts/60 HPF) were observed in BCTIPIR compared with LZIPIR. Realtime PCR and Western blot analysis showed significant downregulation in mRNA and protein expression of VEGF, Bcl-2, and survivin in BCTIPIR compared with LZIPIR. These findings indicated for the first time that silencing beta-catenin abolished IP-mediated cardioprotection, probably through inhibition of VEGF-Bcl-2 and survivin.
Figures


Similar articles
-
Novel role of NADPH oxidase in ischemic myocardium: a study with Nox2 knockout mice.Funct Integr Genomics. 2012 Aug;12(3):501-14. doi: 10.1007/s10142-011-0256-x. Epub 2011 Oct 29. Funct Integr Genomics. 2012. PMID: 22038056
-
Glycogen synthase kinase-3beta/beta-catenin promotes angiogenic and anti-apoptotic signaling through the induction of VEGF, Bcl-2 and survivin expression in rat ischemic preconditioned myocardium.J Mol Cell Cardiol. 2006 Jan;40(1):138-47. doi: 10.1016/j.yjmcc.2005.09.009. Epub 2005 Nov 9. J Mol Cell Cardiol. 2006. PMID: 16288908
-
Ischemic postconditioning mediates cardioprotection via PI3K/GSK-3β/β-catenin signaling pathway in ischemic rat myocardium.Shock. 2012 Aug;38(2):165-9. doi: 10.1097/SHK.0b013e31825b5633. Shock. 2012. PMID: 22576003
-
Angiogenic signal triggered by ischemic stress induces myocardial repair in rat during chronic infarction.J Mol Cell Cardiol. 2004 Apr;36(4):547-59. doi: 10.1016/j.yjmcc.2004.02.002. J Mol Cell Cardiol. 2004. PMID: 15081314
-
Disruption of hypoxia-inducible transcription factor-prolyl hydroxylase domain-1 (PHD-1-/-) attenuates ex vivo myocardial ischemia/reperfusion injury through hypoxia-inducible factor-1α transcription factor and its target genes in mice.Antioxid Redox Signal. 2011 Oct 1;15(7):1789-97. doi: 10.1089/ars.2010.3769. Epub 2011 Apr 8. Antioxid Redox Signal. 2011. PMID: 21083501 Free PMC article.
Cited by
-
GLP1 protects cardiomyocytes from palmitate-induced apoptosis via Akt/GSK3b/b-catenin pathway.J Mol Endocrinol. 2015 Dec;55(3):245-62. doi: 10.1530/JME-15-0155. Epub 2015 Sep 18. J Mol Endocrinol. 2015. PMID: 26386043 Free PMC article.
-
Novel role of NADPH oxidase in ischemic myocardium: a study with Nox2 knockout mice.Funct Integr Genomics. 2012 Aug;12(3):501-14. doi: 10.1007/s10142-011-0256-x. Epub 2011 Oct 29. Funct Integr Genomics. 2012. PMID: 22038056
-
Magnetic resonance imaging of infarct-induced canonical wingless/integrated (Wnt)/β-catenin/T-cell factor pathway activation, in vivo.Cardiovasc Res. 2016 Dec;112(3):645-655. doi: 10.1093/cvr/cvw214. Epub 2016 Sep 26. Cardiovasc Res. 2016. PMID: 27671803 Free PMC article.
-
Disruption of VEGF Mediated Flk-1 Signaling Leads to a Gradual Loss of Vessel Health and Cardiac Function During Myocardial Infarction: Potential Therapy With Pellino-1.J Am Heart Assoc. 2018 Sep 18;7(18):e007601. doi: 10.1161/JAHA.117.007601. J Am Heart Assoc. 2018. PMID: 30371196 Free PMC article.
-
Molecular mechanisms of action and therapeutic uses of pharmacological inhibitors of HIF-prolyl 4-hydroxylases for treatment of ischemic diseases.Antioxid Redox Signal. 2014 Jun 1;20(16):2631-65. doi: 10.1089/ars.2013.5186. Epub 2013 Oct 31. Antioxid Redox Signal. 2014. PMID: 23992027 Free PMC article. Review.
References
-
- Alkhulaifi AM. Preconditioning the human heart during aorto-coronary bypass surgery. J Cardiovasc Surg. 1994;8:270–275. - PubMed
-
- Behrens J. von Kries JP. Kühl M. Bruhn L. Wedlich D. Grosschedl R. Birchmeier W. Functional interaction of bold beta-catenin with the transcription factor LEF-1. Nature. 1996;382:638–642. - PubMed
-
- Bienz M. TCF: transcriptional activator or repressor? Curr Opin Cell Biol. 1998;10:366–372. - PubMed
-
- Cattelino A. Liebner S. Gallini R. Zanetti A. Balconi G. Corsi A. Bianco P. Wolburg H. Moore R. Oreda B. Kemler R. Dejana E. The conditional inactivation of the beta-catenin gene in endothelial cells causes a defective vascular pattern and increased vascular fragility. J Cell Biol. 2003;162:1111–1122. - PMC - PubMed
Publication types
MeSH terms
Substances
Grants and funding
LinkOut - more resources
Full Text Sources

