

In situ detection and measurement of intracellular reactive oxygen species in single isolated mature skeletal muscle fibers by real time fluorescence microscopy
- PMID: 18407749
- PMCID: PMC2536563
- DOI: 10.1089/ars.2007.2009
In situ detection and measurement of intracellular reactive oxygen species in single isolated mature skeletal muscle fibers by real time fluorescence microscopy
Abstract
Reactive oxygen species (ROS) produced by skeletal muscle stimulate adaptive responses to activity and mediate some degenerative processes. ROS activity is usually studied by measuring indirect end-points of their reactions with various biomolecules. In order to develop a method to measure the intracellular ROS generation in real-time in mature skeletal muscle fibers, these were isolated from the flexor digitorum brevis (FDB) muscle of mice and cultured on collagen-coated plates. Fibers were loaded with 5- (and 6-) chloromethyl-2',7'-dichlorodihydrofluorescein diacetate (CM-DCFH DA) and measurements of 5- (and 6-) chloromethyl-2',7'-dichlorofluorescin (CM-DCF) fluorescence from individual fibers obtained by microscopy over 45 min. The sensitivity of this approach was demonstrated by addition of 1 microM H(2)O(2) to the extracellular medium. Contractions of isolated fibers induced by field electrical stimulation caused a significant increase in CM-DCF fluorescence that was abolished by pre-treatment of fibers with glutathione ethyl ester. Thus, CM-DCF fluorescence microscopy can detect physiologically relevant changes in intracellular ROS activity in single isolated mature skeletal muscle fibers in real-time, and contractions generated a net increase that was abolished when the intracellular glutathione content was enhanced. This technique has advantages over previous approaches because of the maturity of the fibers and the analysis of single cells, which prevent contributions from nonmuscle cells.
Figures
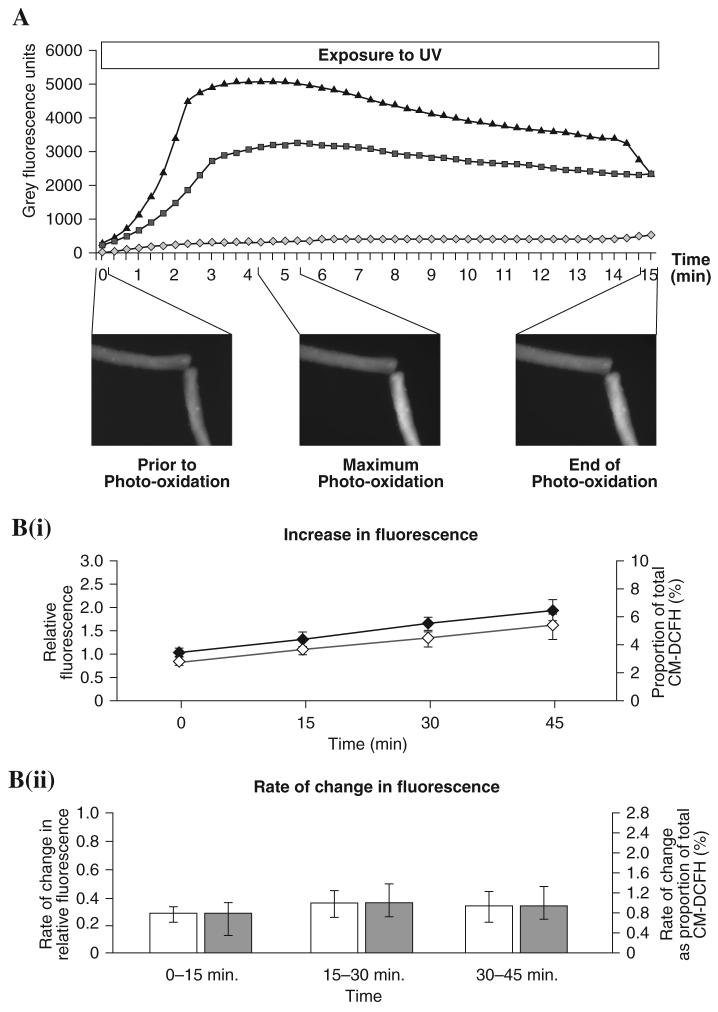
 ), fiber 2 fluorescence (–▲–), background fluorescence (
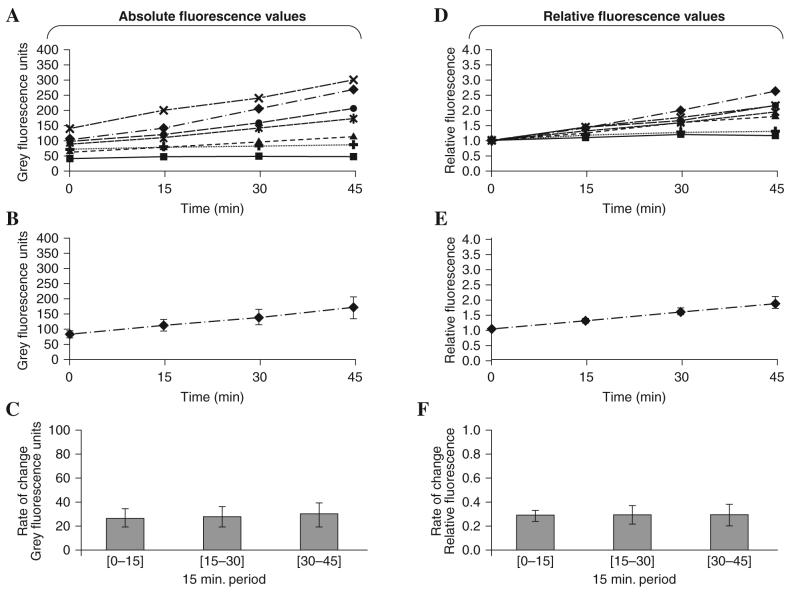
 ). Inset images show the morphology and fluorescence emission of the fibers prior to photo-oxidation, at the point when maximum photo-oxidation was observed and at the end of the UV exposure. (B) Comparison of two approaches to normalize values of fluorescence obtained from fibers. (B-i) Mean changes in fluorescence where data were normalized to the initial value from that fiber (◆), or data are expressed as a proportion of the total CM-DCFH within the fiber (◇). (B-ii) Rate of change in fluorescence where data were normalized to the initial value from that fiber (□), or data are expressed as a proportion of the total CM-DCFH within the fiber (
 ). Values are expressed as mean ± S.E.M. for five fibers.
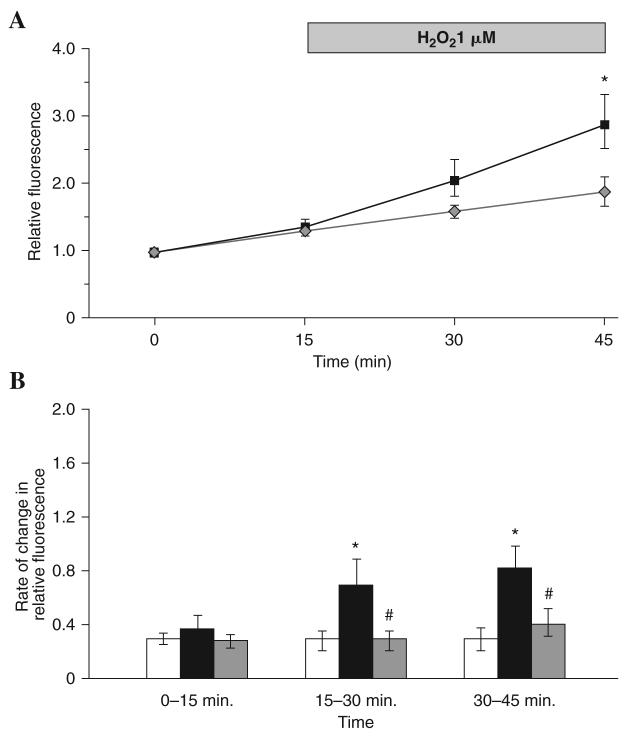
 ) compared with fibers exposed to 1 μM H2O2 at the 15 min time point (■). (B). Rate of change of relative DCF fluorescence in control fibers (□), fibers exposed to 1 μM H2O2 for 30 min starting at the 15 min time point (■) and fibers pre -treated with 5 mM glutathione ethyl ester (GSHEE) for 2 h prior to CM-DCFH DA loading and exposure to 1 μM H2O2 for 30 min starting at the 15 min time point (
 ). *Statistically significant compared with control fibers during the same time period; #statistically significant compared with fibers exposed to H2O2 during the same time period. Data were analyzed using a one-way ANOVA (p < 0.05), post hoc LSD (p < 0.05) and are shown as mean ± S.E.M, n 5–7 fibers in each group.
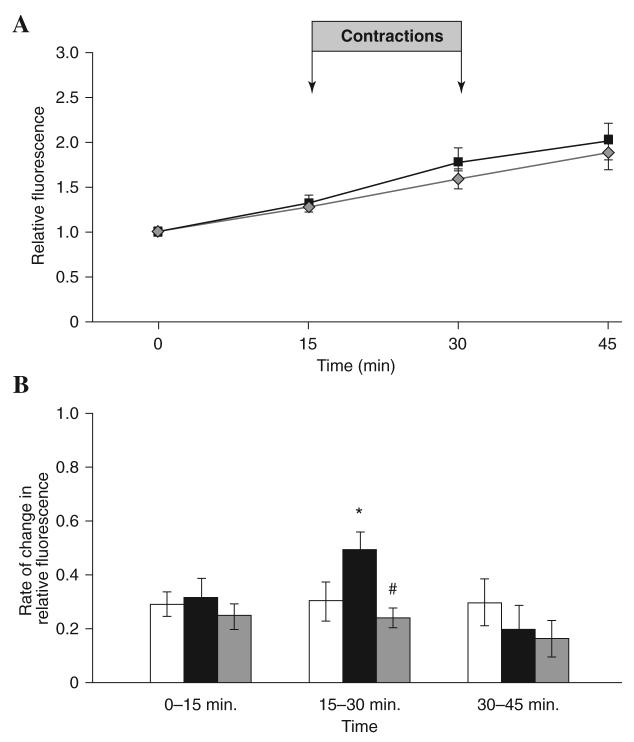
 ) compared with fibers that underwent contractile activity induced by electrical stimulation over the 15–30 min period (■). (B). Rate of change of relative DCF fluorescence in control fibers (□), fibers subjected to contractile activity induced by electrical stimulation over the 15–30 min period (■), and fibers pre -treated with 5 mM glutathione ethyl ester (GSHEE) for 2 h prior to CM-DCFH DA loading and subjected to contractile activity induced by electrical stimulation over the 15–30 min period (
 ). *Statistically significant compared with control fibers during the same time period; #statistically significant compared with fibers subjected to contractile activity induced by electrical stimulation over 15–30 min period. Data were analyzed using a one-way ANOVA (p < 0.05), post hoc LSD (p < 0.05) and are shown as mean ± S.E.M, n 7–13 fibers in each group.
References
-
- Afzal M, Matsugo S, Sasai M, Xu B, Aoyama K, Takeuchi T. Method to overcome photoreaction, a serious drawback to the use of dichlorofluorescin in evaluation of reactive oxygen species. Biochem Biophys Res Commun. 2003;304:619–624. - PubMed
-
- Anderson J, Pilipowicz O. Activation of muscle satellite cells in single-fiber cultures. Nitric Oxide Biol Chem. 2002;7:36–41. - PubMed
-
- Andrade F, Reid MB, Westerbald H. Contractile responses of skeletal muscle to low peroxide concentrations: myofibrillar calcium sensitivity as a likely target of redox modulation. FASEB J. 2000;15:309–311. - PubMed
-
- Antunes F, Cadenas E. Estimation of H2O2 gradients across biomembranes. FEBS Lett. 2000;475:121–126. - PubMed
-
- Arbogast S, Reid MB. Oxidant activity in skeletal muscle fibers is influenced by temperature, CO2 level, and muscle-derived nitric oxide. Am J Physiol Regul Integr Comp Physiol. 2004;287:R698–R705. - PubMed
Publication types
MeSH terms
Substances
Grants and funding
LinkOut - more resources
Full Text Sources
