

Peginterferon pharmacokinetics in African American and Caucasian American patients with hepatitis C virus genotype 1 infection
- PMID: 18407798
- PMCID: PMC2704736
- DOI: 10.1016/j.cgh.2008.02.035
Peginterferon pharmacokinetics in African American and Caucasian American patients with hepatitis C virus genotype 1 infection
Abstract
Background & aims: The relationship between serum peginterferon pharmacokinetics and pharmacodynamics and the early virologic response (EVR) to peginterferon and ribavirin therapy was assessed in patients with chronic hepatitis C virus (HCV) genotype 1 infection.
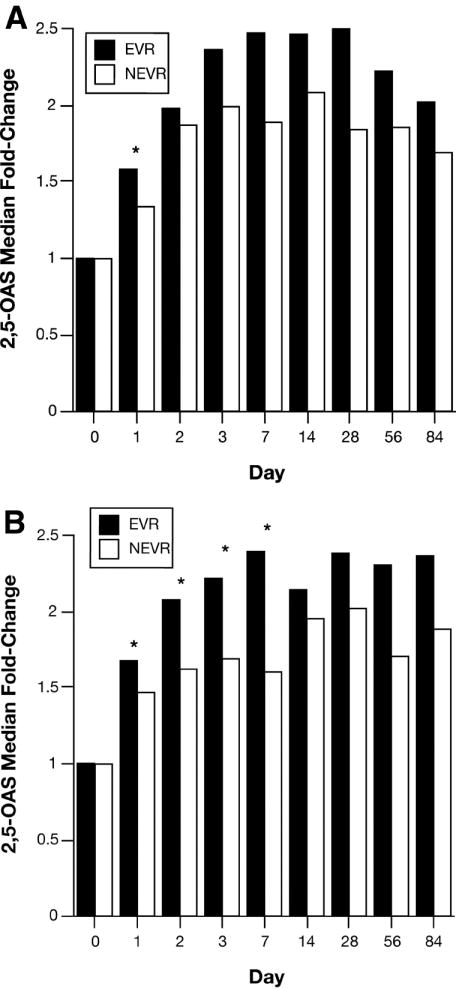
Methods: A total of 333 patients (160 African Americans [AA] and 173 Caucasian Americans [CA]) who received peginterferon alpha-2a (180 microg/wk) without a dose modification during the initial 4 weeks of therapy were analyzed. Peginterferon and 2,5-oligoadenylate synthetase (2,5-OAS) serum levels were measured on days 0, 1, 2, 3, 7, 14, 28, 56, 84, and 168 of treatment. The EVR (>or=2-log(10) decline in HCV RNA levels by week 12 of therapy) was the primary virologic end point.
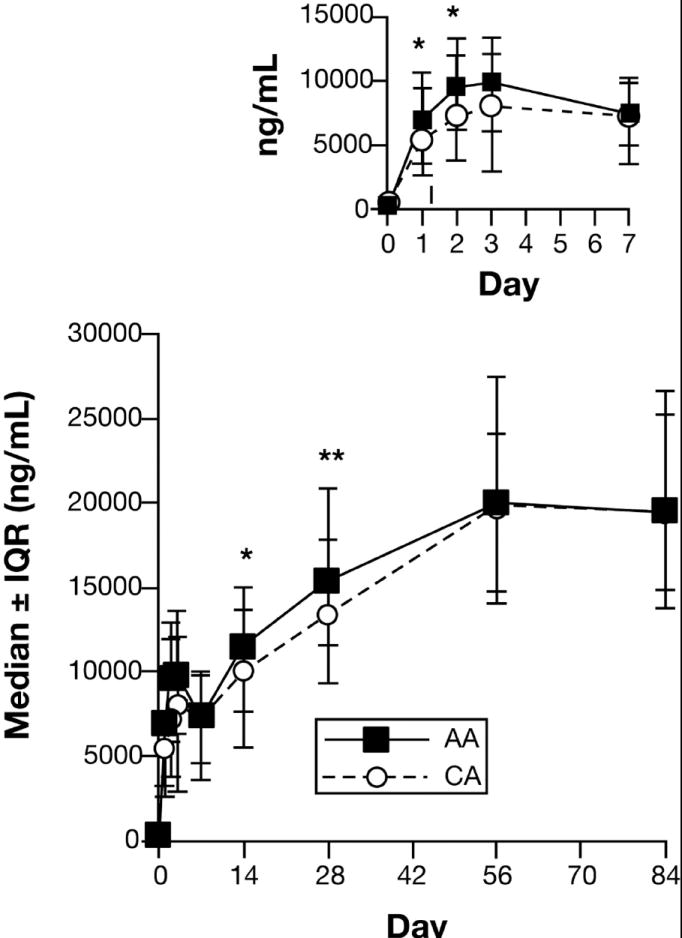
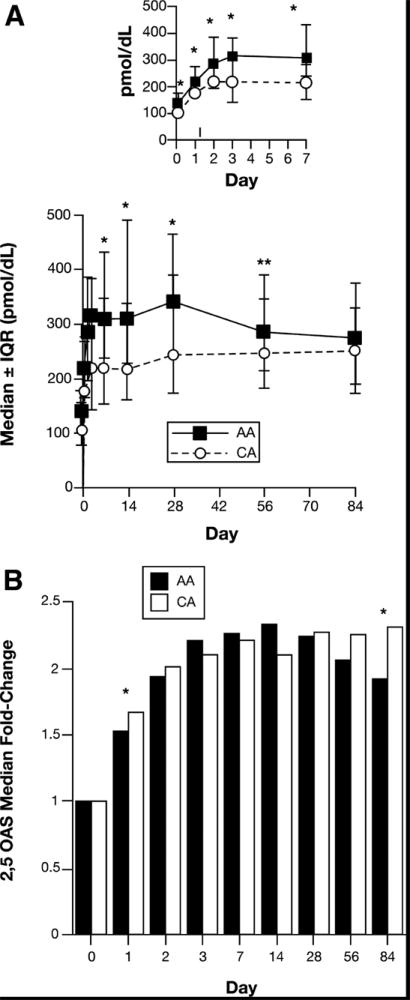
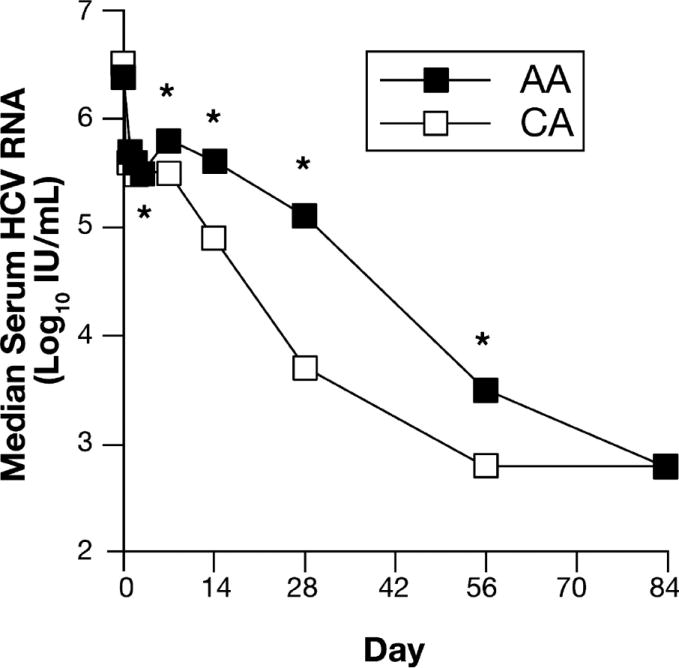
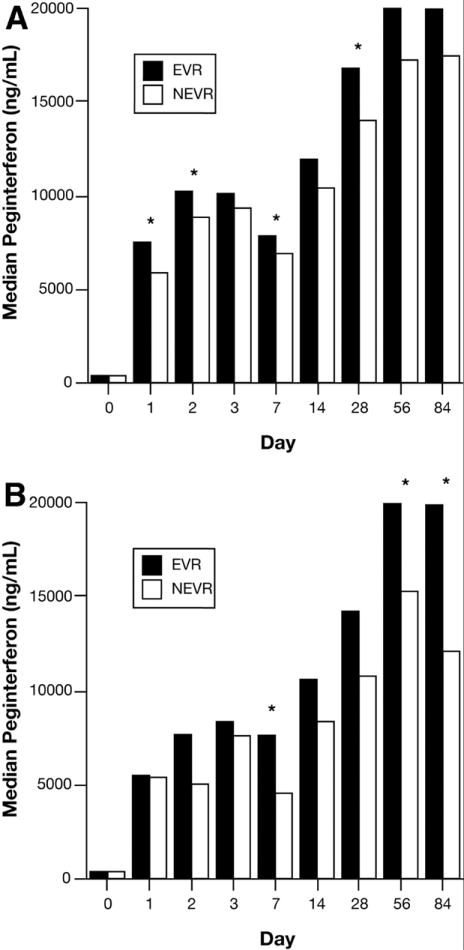
Results: Peginterferon pharmacokinetics after the first dose were similar in AA and CA, but AA had greater peginterferon concentrations at days 1, 3, 14, and 28 (P < .05). AA had higher absolute serum 2,5-OAS levels on days 0, 1, 2, 3, 7, 14, 28, and 56 (P < .05), but the magnitude of 2,5-OAS induction during treatment were similar. AA patients showed a smaller decline in serum HCV RNA during the first 28 days of treatment (P < .001) and a lower EVR (65% vs 83%). AA and CA with EVR had significantly higher serum peginterferon concentrations and serum 2,5-OAS induction during the first 12 weeks than patients without an EVR.
Conclusions: Peginterferon alpha-2a pharmacokinetic and pharmacodynamic variability is associated with EVR in both AA and CA with HCV infection, but do not explain the racial disparity in combination treatment efficacy.
Figures
Similar articles
-
Peginterferon and ribavirin treatment in African American and Caucasian American patients with hepatitis C genotype 1.Gastroenterology. 2006 Aug;131(2):470-7. doi: 10.1053/j.gastro.2006.06.008. Gastroenterology. 2006. PMID: 16890601 Clinical Trial.
-
Peginterferon-alpha-2a (40KD) and ribavirin for 16 or 24 weeks in patients with genotype 2 or 3 chronic hepatitis C.Gastroenterology. 2005 Aug;129(2):522-7. doi: 10.1016/j.gastro.2005.05.008. Gastroenterology. 2005. PMID: 16083709 Clinical Trial.
-
The pharmacokinetics of peginterferon alfa-2a and ribavirin in African American, Hispanic and Caucasian patients with chronic hepatitis C.Aliment Pharmacol Ther. 2012 May;35(10):1209-20. doi: 10.1111/j.1365-2036.2012.05079.x. Epub 2012 Apr 3. Aliment Pharmacol Ther. 2012. PMID: 22469033
-
Pegylated interferon plus ribavirin for the treatment of chronic hepatitis C.Rev Gastroenterol Disord. 2003 Spring;3(2):93-109. Rev Gastroenterol Disord. 2003. PMID: 12776006 Review.
-
Peginterferon-alpha-2a (40kD) plus ribavirin: a review of its use in the management of chronic hepatitis C.Drugs. 2003;63(7):701-30. doi: 10.2165/00003495-200363070-00008. Drugs. 2003. PMID: 12656650 Review.
Cited by
-
Pegylated interferon fractal pharmacokinetics: individualized dosing for hepatitis C virus infection.Antimicrob Agents Chemother. 2013 Mar;57(3):1115-20. doi: 10.1128/AAC.02208-12. Epub 2012 Nov 26. Antimicrob Agents Chemother. 2013. PMID: 23183434 Free PMC article.
-
Optimum ribavirin exposure overcomes racial disparity in efficacy of peginterferon and ribavirin treatment for hepatitis C genotype 1.Am J Gastroenterol. 2012 Nov;107(11):1675-83. doi: 10.1038/ajg.2012.306. Epub 2012 Oct 23. Am J Gastroenterol. 2012. PMID: 23090351 Free PMC article.
-
Single nucleotide polymorphism upstream of interleukin 28B associated with phase 1 and phase 2 of early viral kinetics in patients infected with HCV genotype 1.J Hepatol. 2012 Mar;56(3):557-63. doi: 10.1016/j.jhep.2011.10.004. Epub 2011 Oct 23. J Hepatol. 2012. PMID: 22027585 Free PMC article.
-
Pegylated interferon pharmacokinetics and self-reported depressive symptoms during antiviral treatment for chronic hepatitis C.Pharmacopsychiatry. 2014 Sep;47(6):195-201. doi: 10.1055/s-0034-1385929. Epub 2014 Aug 14. Pharmacopsychiatry. 2014. PMID: 25121993 Free PMC article.
-
Chronic hepatitis C and antiviral treatment regimens: where can psychology contribute?J Consult Clin Psychol. 2013 Apr;81(2):361-74. doi: 10.1037/a0029030. Epub 2012 Jun 25. J Consult Clin Psychol. 2013. PMID: 22730952 Free PMC article. Review.
References
-
- Alter MJ, Kruszon-Moran D, Nainan OV, McQuillan GM, Gao F, Moyer LA, Kaslow RA, Margolis HS. The prevalence of hepatitis C infection in the United States, 1988 through 1999. N Engl J Med. 1999;341:556–62. - PubMed
-
- Muir AJ, Bornstein JD, Killenberg PG. Peginterferon alfa-2b and ribavirin for the treatment of chronic hepatitis C in blacks and non-hispanic whites. N Engl J Med. 2004;350:2265–71. - PubMed
-
- Jeffers L, Cassidy W, Howell CD, Hu S, Reddy KR. Peginterferon alfa-2a (40 kd) and ribavirin for black American patients with chronic hepatitis C virus genotype 1. Hepatology. 2004;39:1702–08. - PubMed
-
- Conjeevaram HS, Fried MW, Jeffers LJ, Terrault N, Wiley-Lucas T, Afdhal N, Brown RSJ, Belle SH, Robuck PR, Howell CD. Peginterferon and Ribavirin Treatment in African American and Caucasian American Patients with Chronic Hepatitis C Genotype 1. Gastroenterology. 2006;31:470–7. - PubMed
-
- Stark GR, Kerr IM, Williams BRG, Silverman RH, Schreiber RD. How cells respond to interferons. Annu Rev Biochem. 1998;67:227–64. - PubMed
Publication types
MeSH terms
Substances
Grants and funding
- U01 DK60329/DK/NIDDK NIH HHS/United States
- M01 RR000079/RR/NCRR NIH HHS/United States
- U01 DK60344/DK/NIDDK NIH HHS/United States
- U01 DK60342/DK/NIDDK NIH HHS/United States
- U01 DK60349/DK/NIDDK NIH HHS/United States
- U01 DK060327/DK/NIDDK NIH HHS/United States
- U01 DK60324/DK/NIDDK NIH HHS/United States
- M01 RR016500/RR/NCRR NIH HHS/United States
- 1 K24 DK072036-01/DK/NIDDK NIH HHS/United States
- M01 RR000042/RR/NCRR NIH HHS/United States
- U01 DK060340/DK/NIDDK NIH HHS/United States
- U01 DK60345/DK/NIDDK NIH HHS/United States
- U01 DK060345/DK/NIDDK NIH HHS/United States
- M01 RR000645/RR/NCRR NIH HHS/United States
- M01 RR000046/RR/NCRR NIH HHS/United States
- M01 RR16500/RR/NCRR NIH HHS/United States
- U01 DK60309/DK/NIDDK NIH HHS/United States
- K24 DK072036/DK/NIDDK NIH HHS/United States
- M01 RR00645/RR/NCRR NIH HHS/United States
- M01 RR00046/RR/NCRR NIH HHS/United States
- U01 DK060349/DK/NIDDK NIH HHS/United States
- U01 DK60327/DK/NIDDK NIH HHS/United States
- U01 DK60352/DK/NIDDK NIH HHS/United States
- U01 DK60341/DK/NIDDK NIH HHS/United States
- U01 DK060342/DK/NIDDK NIH HHS/United States
- M02 RR000079/RR/NCRR NIH HHS/United States
- U01 DK060341/DK/NIDDK NIH HHS/United States
- U01 DK060352/DK/NIDDK NIH HHS/United States
- U01 DK060335/DK/NIDDK NIH HHS/United States
- U01 DK60335/DK/NIDDK NIH HHS/United States
- U01 DK60346/DK/NIDDK NIH HHS/United States
- U01 DK060324/DK/NIDDK NIH HHS/United States
- U01 DK060309/DK/NIDDK NIH HHS/United States
- U01 DK060344/DK/NIDDK NIH HHS/United States
- U01 DK060346/DK/NIDDK NIH HHS/United States
- U01 DK60340/DK/NIDDK NIH HHS/United States
- U01 DK060329/DK/NIDDK NIH HHS/United States
LinkOut - more resources
Full Text Sources
