The predictive receiver operating characteristic curve for the joint assessment of the positive and negative predictive values
- PMID: 18407893
- PMCID: PMC3227148
- DOI: 10.1098/rsta.2008.0043
The predictive receiver operating characteristic curve for the joint assessment of the positive and negative predictive values
Abstract
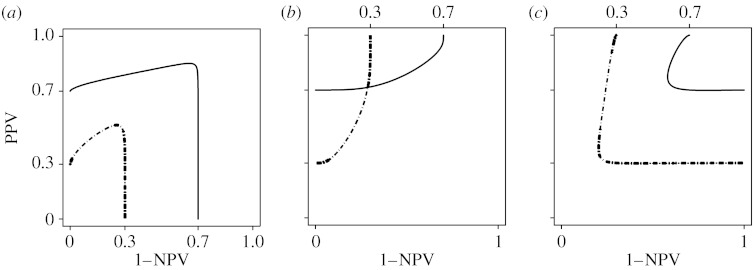
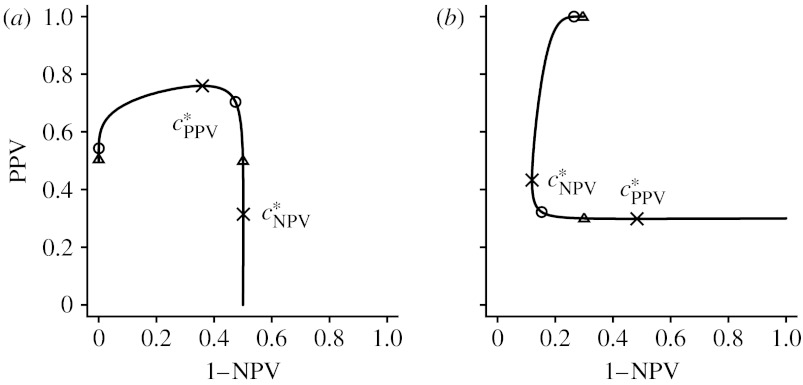
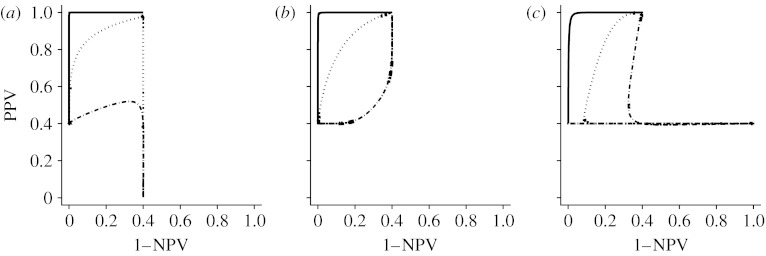
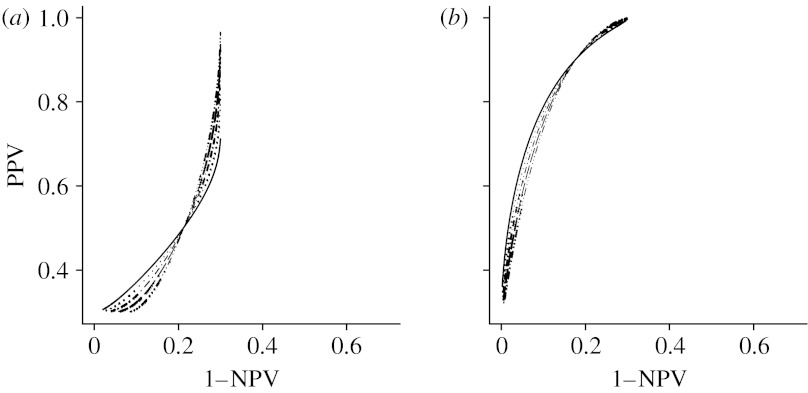
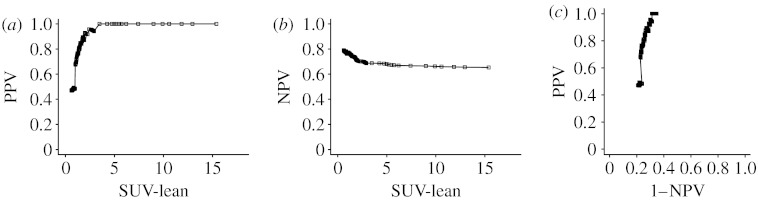
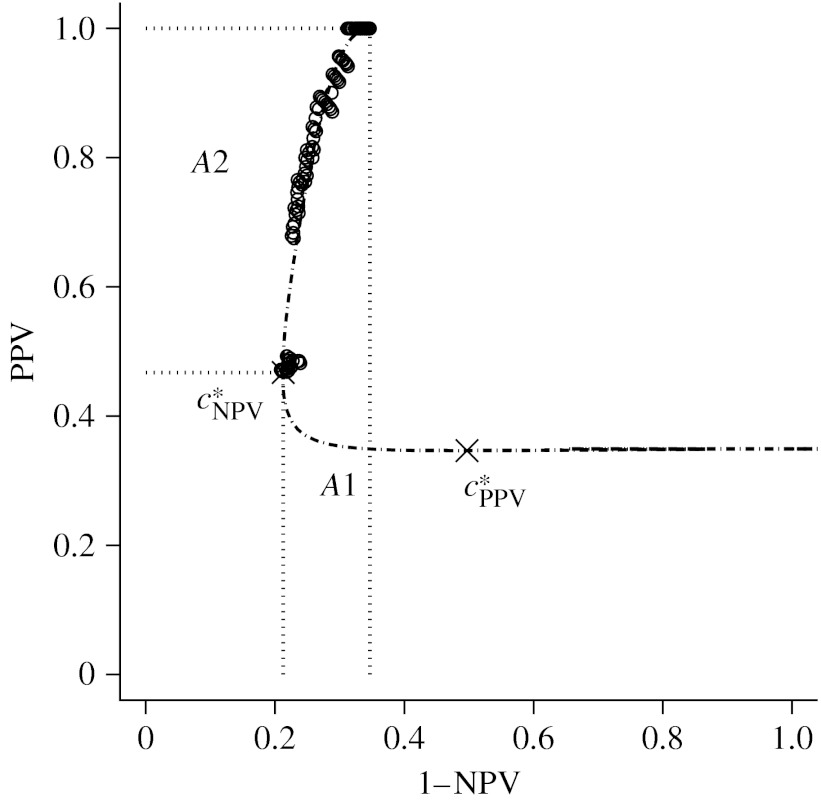
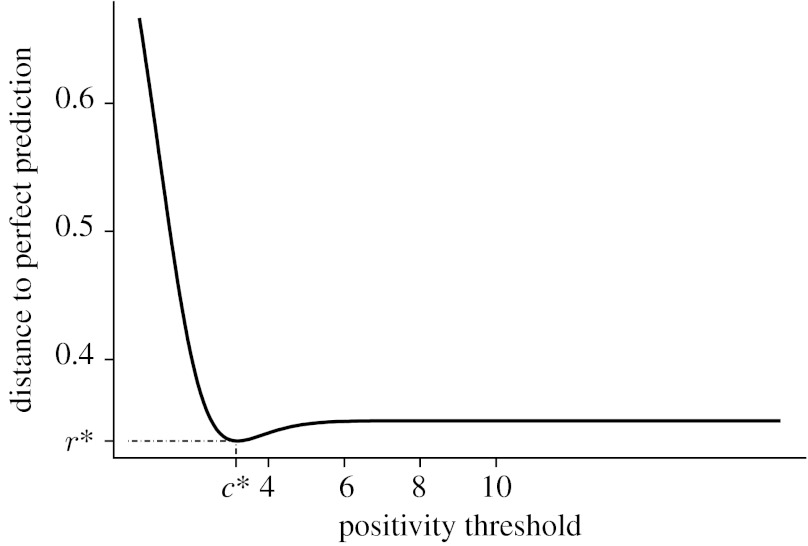
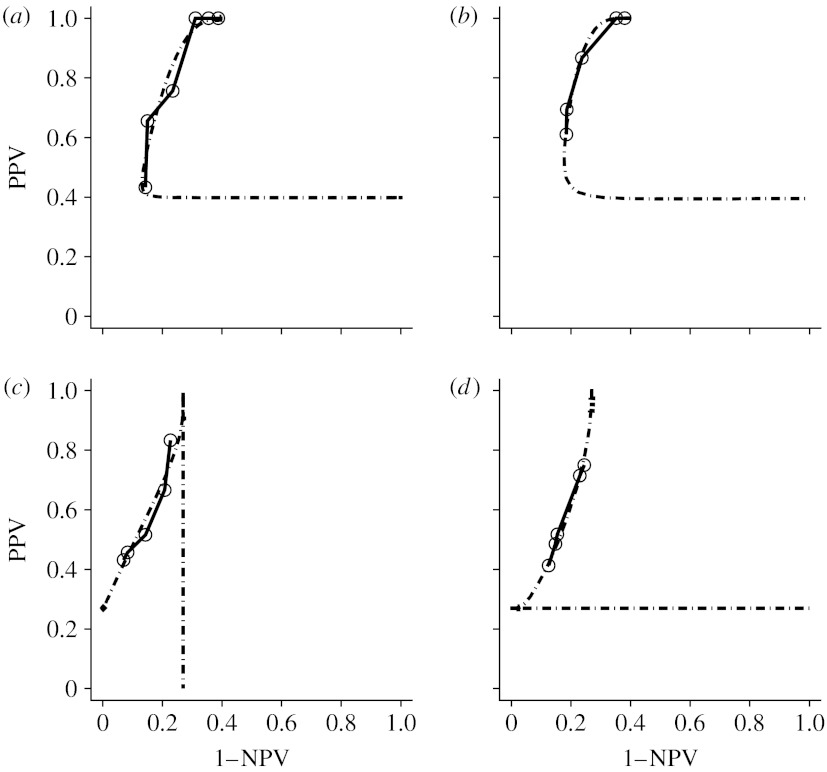
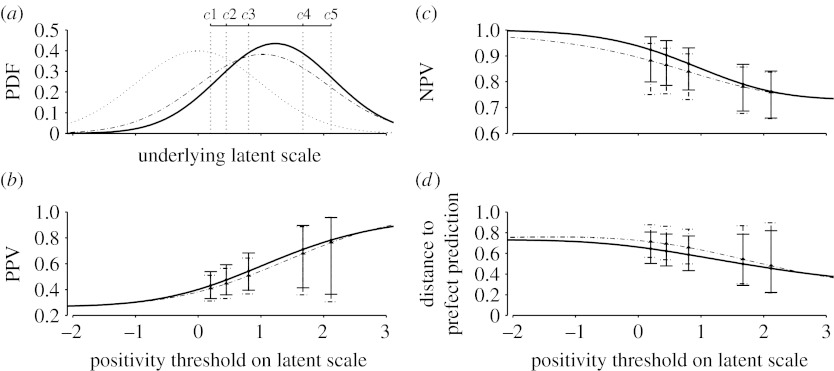
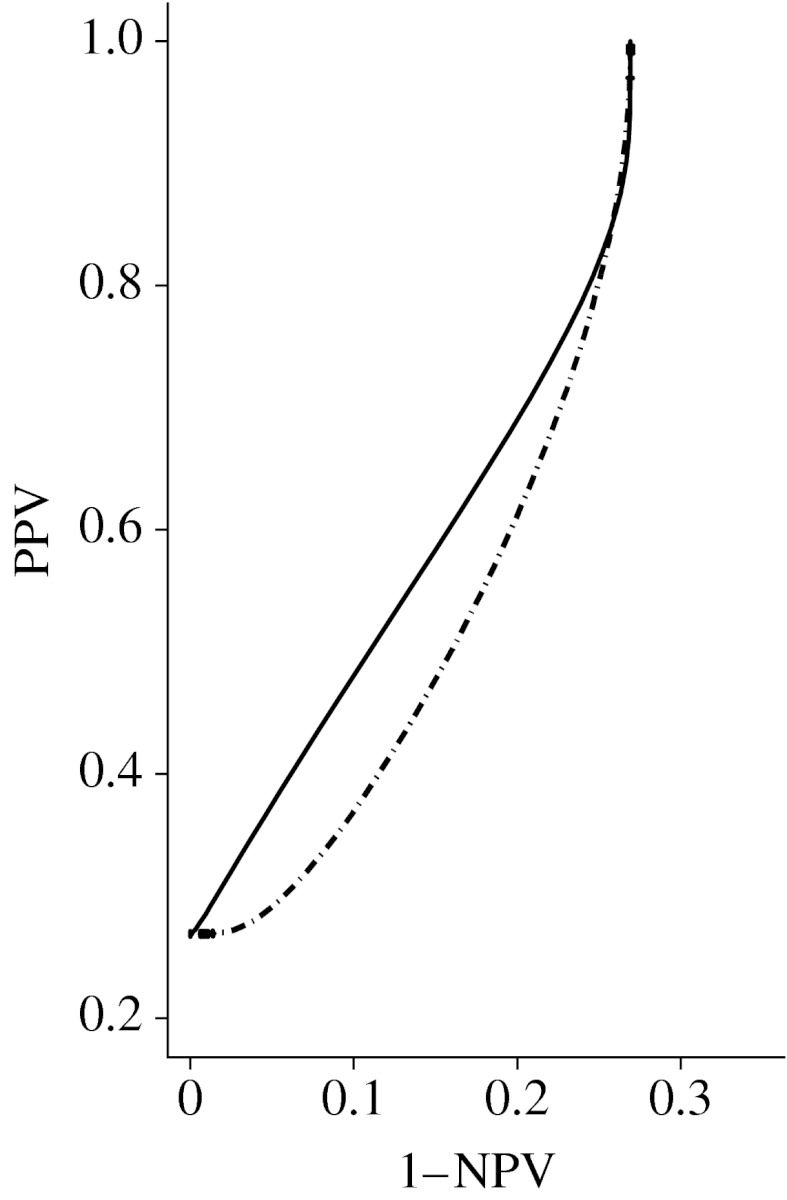
Binary test outcomes typically result from dichotomizing a continuous test variable, observable or latent. The effect of the threshold for test positivity on test sensitivity and specificity has been studied extensively in receiver operating characteristic (ROC) analysis. However, considerably less attention has been given to the study of the effect of the positivity threshold on the predictive value of a test. In this paper we present methods for the joint study of the positive (PPV) and negative predictive values (NPV) of diagnostic tests. We define the predictive receiver operating characteristic (PROC) curve that consists of all possible pairs of PPV and NPV as the threshold for test positivity varies. Unlike the simple trade-off between sensitivity and specificity exhibited in the ROC curve, the PROC curve displays what is often a complex interplay between PPV and NPV as the positivity threshold changes. We study the monotonicity and other geometric properties of the PROC curve and propose summary measures for the predictive performance of tests. We also formulate and discuss regression models for the estimation of the effects of covariates.
Figures


Similar articles
-
Bootstrap-based procedures for inference in nonparametric receiver-operating characteristic curve regression analysis.Stat Methods Med Res. 2018 Mar;27(3):740-764. doi: 10.1177/0962280217742542. Epub 2017 Dec 12. Stat Methods Med Res. 2018. PMID: 29233083
-
Prediction of the usefulness of combined mammography and scintimammography in suspected primary breast cancer using ROC curves.J Nucl Med. 2001 Jan;42(1):3-8. J Nucl Med. 2001. PMID: 11197976
-
Mutual Information as a Performance Measure for Binary Predictors Characterized by Both ROC Curve and PROC Curve Analysis.Entropy (Basel). 2020 Aug 26;22(9):938. doi: 10.3390/e22090938. Entropy (Basel). 2020. PMID: 33286707 Free PMC article.
-
Statistics in the pathology laboratory: characteristics of diagnostic tests.Pathology. 2001 Feb;33(1):93-5. doi: 10.1080/00313020120034966. Pathology. 2001. PMID: 11280616 Review.
-
Statistical Methods for Comparing Predictive Values in Medical Diagnosis.Korean J Radiol. 2024 Jul;25(7):656-661. doi: 10.3348/kjr.2024.0049. Korean J Radiol. 2024. PMID: 38942459 Free PMC article. Review.
Cited by
-
A Software Tool for Exploring the Relation between Diagnostic Accuracy and Measurement Uncertainty.Diagnostics (Basel). 2020 Aug 19;10(9):610. doi: 10.3390/diagnostics10090610. Diagnostics (Basel). 2020. PMID: 32825135 Free PMC article.
-
Establishment and Characterization of an Empirical Biomarker SS/PV-ROC Plot Using Results of the UBC® Rapid Test in Bladder Cancer.Entropy (Basel). 2020 Jun 30;22(7):729. doi: 10.3390/e22070729. Entropy (Basel). 2020. PMID: 33286501 Free PMC article.
-
Sophisticated diagnostic modalities.Philos Trans A Math Phys Eng Sci. 2008 Jul 13;366(1874):2251-2. doi: 10.1098/rsta.2008.0046. Philos Trans A Math Phys Eng Sci. 2008. PMID: 18407891 Free PMC article. No abstract available.
-
Performance metric curve analysis framework to assess impact of the decision variable threshold, disease prevalence, and dataset variability in two-class classification.J Med Imaging (Bellingham). 2022 May;9(3):035502. doi: 10.1117/1.JMI.9.3.035502. Epub 2022 May 31. J Med Imaging (Bellingham). 2022. PMID: 35656541 Free PMC article.
-
On the Binormal Predictive Receiver Operating Characteristic Curve for the Joint Assessment of Positive and Negative Predictive Values.Entropy (Basel). 2020 May 26;22(6):593. doi: 10.3390/e22060593. Entropy (Basel). 2020. PMID: 33286365 Free PMC article.
References
-
- Aerts, M., Geys, H. & Molenberghs, G. 2002 Topics in modelling of clustered data, ch. 6. Monographs on Statistics and Applied Probability no. 96. Boca Raton, FL: Chapman & Hall.
-
- Arnold B.C., Strauss D. Pseudolikelihood estimation: some examples. Sankhya Ser. B. 1991;53:233–243.
-
- Beam C.A., Conant E.F., Sickles E.A. Association of volume and volume-independent factors with accuracy in screening mammogram interpretation. J. Natl Cancer Inst. 2003;95:282–290. - PubMed
Publication types
MeSH terms
Grants and funding
LinkOut - more resources
Full Text Sources