

Platyhelminth mitochondrial and cytosolic redox homeostasis is controlled by a single thioredoxin glutathione reductase and dependent on selenium and glutathione
- PMID: 18408002
- PMCID: PMC2440607
- DOI: 10.1074/jbc.M710609200
Platyhelminth mitochondrial and cytosolic redox homeostasis is controlled by a single thioredoxin glutathione reductase and dependent on selenium and glutathione
Abstract
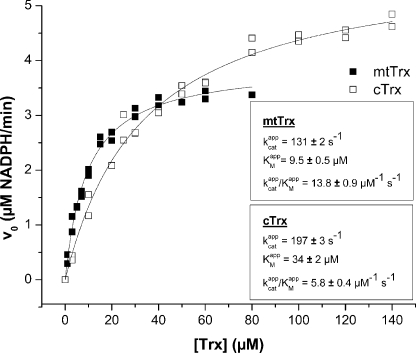
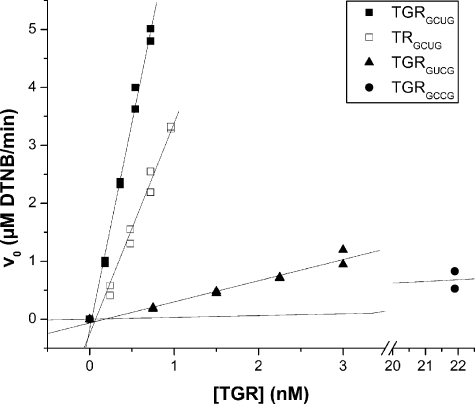
Platyhelminth parasites are a major health problem in developing countries. In contrast to their mammalian hosts, platyhelminth thiol-disulfide redox homeostasis relies on linked thioredoxin-glutathione systems, which are fully dependent on thioredoxin-glutathione reductase (TGR), a promising drug target. TGR is a homodimeric enzyme comprising a glutaredoxin domain and thioredoxin reductase (TR) domains with a C-terminal redox center containing selenocysteine (Sec). In this study, we demonstrate the existence of functional linked thioredoxin-glutathione systems in the cytosolic and mitochondrial compartments of Echinococcus granulosus, the platyhelminth responsible for hydatid disease. The glutathione reductase (GR) activity of TGR exhibited hysteretic behavior regulated by the [GSSG]/[GSH] ratio. This behavior was associated with glutathionylation by GSSG and abolished by deglutathionylation. The K(m) and k(cat) values for mitochondrial and cytosolic thioredoxins (9.5 microm and 131 s(-1), 34 microm and 197 s(-1), respectively) were higher than those reported for mammalian TRs. Analysis of TGR mutants revealed that the glutaredoxin domain is required for the GR activity but did not affect the TR activity. In contrast, both GR and TR activities were dependent on the Sec-containing redox center. The activity loss caused by the Sec-to-Cys mutation could be partially compensated by a Cys-to-Sec mutation of the neighboring residue, indicating that Sec can support catalysis at this alternative position. Consistent with the essential role of TGR in redox control, 2.5 microm auranofin, a known TGR inhibitor, killed larval worms in vitro. These studies establish the selenium- and glutathione-dependent regulation of cytosolic and mitochondrial redox homeostasis through a single TGR enzyme in platyhelminths.
Figures


Similar articles
-
Linked thioredoxin-glutathione systems in platyhelminth parasites: alternative pathways for glutathione reduction and deglutathionylation.J Biol Chem. 2011 Feb 18;286(7):4959-67. doi: 10.1074/jbc.M110.170761. Epub 2010 Nov 4. J Biol Chem. 2011. PMID: 21051543 Free PMC article.
-
Thioredoxin glutathione reductase-dependent redox networks in platyhelminth parasites.Antioxid Redox Signal. 2013 Sep 1;19(7):735-45. doi: 10.1089/ars.2012.4670. Epub 2012 Oct 3. Antioxid Redox Signal. 2013. PMID: 22909029 Free PMC article. Review.
-
Biochemical and thermodynamic comparison of the selenocysteine containing and non-containing thioredoxin glutathione reductase of Fasciola gigantica.Biochim Biophys Acta Gen Subj. 2018 Jun;1862(6):1306-1316. doi: 10.1016/j.bbagen.2018.03.007. Epub 2018 Mar 9. Biochim Biophys Acta Gen Subj. 2018. PMID: 29526505
-
Thioredoxin and glutathione systems differ in parasitic and free-living platyhelminths.BMC Genomics. 2010 Apr 13;11:237. doi: 10.1186/1471-2164-11-237. BMC Genomics. 2010. PMID: 20385027 Free PMC article.
-
Linked thioredoxin-glutathione systems in platyhelminths.Trends Parasitol. 2004 Jul;20(7):340-6. doi: 10.1016/j.pt.2004.05.002. Trends Parasitol. 2004. PMID: 15193566 Review.
Cited by
-
Inhibition of Tapeworm Thioredoxin and Glutathione Pathways by an Oxadiazole N-Oxide Leads to Reduced Mesocestoides vogae Infection Burden in Mice.Molecules. 2015 Jun 26;20(7):11793-807. doi: 10.3390/molecules200711793. Molecules. 2015. PMID: 26132905 Free PMC article.
-
Evolutionary Adaptations of Parasitic Flatworms to Different Oxygen Tensions.Antioxidants (Basel). 2022 May 31;11(6):1102. doi: 10.3390/antiox11061102. Antioxidants (Basel). 2022. PMID: 35739999 Free PMC article. Review.
-
The Current Directions of Searching for Antiparasitic Drugs.Molecules. 2022 Feb 24;27(5):1534. doi: 10.3390/molecules27051534. Molecules. 2022. PMID: 35268635 Free PMC article. Review.
-
The redox biology of schistosome parasites and applications for drug development.Curr Pharm Des. 2012;18(24):3595-611. Curr Pharm Des. 2012. PMID: 22607149 Free PMC article. Review.
-
Thioredoxin glutathione reductase as a novel drug target: evidence from Schistosoma japonicum.PLoS One. 2012;7(2):e31456. doi: 10.1371/journal.pone.0031456. Epub 2012 Feb 22. PLoS One. 2012. PMID: 22384025 Free PMC article.
References
-
- WHO (2006) Preventive Chemotherapy in Human Helminthiasis: Coordinated Use of Antihelminthic Drugs in Control Interventions: a Manual for Health Professionals and Programme Managers, WHO Press, World Health Organization, Geneva, Switzerland
-
- Mansour, T. (2002) in Chemotherapeutic Targets in Parasites: Contemporary Strategies (Mansour, T., ed) pp. 58–89, Cambridge University Press, Cambridge
-
- Doenhoff, M. J., and Pica-Mattoccia, L. (2006) Expert Rev. Anti Infect. Ther. 4 199–210 - PubMed
-
- Alger, H. M., and Williams, D. L. (2002) Mol. Biochem. Parasitol. 121 129–139 - PubMed
-
- Agorio, A., Chalar, C., Cardozo, S., and Salinas, G. (2003) J. Biol. Chem. 278 12920–12928 - PubMed
Publication types
MeSH terms
Substances
Grants and funding
LinkOut - more resources
Full Text Sources
Other Literature Sources
Miscellaneous
