Mutations in String/CDC25 inhibit cell cycle re-entry and neurodegeneration in a Drosophila model of Ataxia telangiectasia
- PMID: 18408079
- PMCID: PMC2335316
- DOI: 10.1101/gad.1639608
Mutations in String/CDC25 inhibit cell cycle re-entry and neurodegeneration in a Drosophila model of Ataxia telangiectasia
Abstract
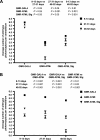
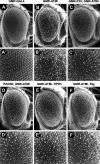
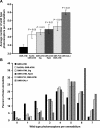
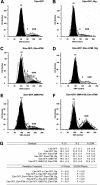
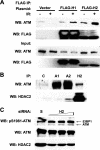
Mutations in ATM (Ataxia telangiectasia mutated) result in Ataxia telangiectasia (A-T), a disorder characterized by progressive neurodegeneration. Despite advances in understanding how ATM signals cell cycle arrest, DNA repair, and apoptosis in response to DNA damage, it remains unclear why loss of ATM causes degeneration of post-mitotic neurons and why the neurological phenotype of ATM-null individuals varies in severity. To address these issues, we generated a Drosophila model of A-T. RNAi knockdown of ATM in the eye caused progressive degeneration of adult neurons in the absence of exogenously induced DNA damage. Heterozygous mutations in select genes modified the neurodegeneration phenotype, suggesting that genetic background underlies variable neurodegeneration in A-T. The neuroprotective activity of ATM may be negatively regulated by deacetylation since mutations in a protein deacetylase gene, RPD3, suppressed neurodegeneration, and a human homolog of RPD3, histone deacetylase 2, bound ATM and abrogated ATM activation in cell culture. Moreover, knockdown of ATM in post-mitotic neurons caused cell cycle re-entry, and heterozygous mutations in the cell cycle activator gene String/CDC25 inhibited cell cycle re-entry and neurodegeneration. Thus, we hypothesize that ATM performs a cell cycle checkpoint function to protect post-mitotic neurons from degeneration and that cell cycle re-entry causes neurodegeneration in A-T.
Figures




Similar articles
-
The innate immune response transcription factor relish is necessary for neurodegeneration in a Drosophila model of ataxia-telangiectasia.Genetics. 2013 May;194(1):133-42. doi: 10.1534/genetics.113.150854. Epub 2013 Mar 15. Genetics. 2013. PMID: 23502677 Free PMC article.
-
ATM and the molecular pathogenesis of ataxia telangiectasia.Annu Rev Pathol. 2012;7:303-21. doi: 10.1146/annurev-pathol-011811-132509. Epub 2011 Oct 24. Annu Rev Pathol. 2012. PMID: 22035194 Review.
-
Phosphorylation of ATM by Cdk5 mediates DNA damage signalling and regulates neuronal death.Nat Cell Biol. 2009 Feb;11(2):211-8. doi: 10.1038/ncb1829. Epub 2009 Jan 18. Nat Cell Biol. 2009. PMID: 19151707 Free PMC article.
-
Nuclear ataxia-telangiectasia mutated (ATM) mediates the cellular response to DNA double strand breaks in human neuron-like cells.J Biol Chem. 2006 Jun 23;281(25):17482-17491. doi: 10.1074/jbc.M601895200. Epub 2006 Apr 20. J Biol Chem. 2006. PMID: 16627474
-
ATM: the product of the gene mutated in ataxia-telangiectasia.Int J Biochem Cell Biol. 1999 Jul;31(7):735-40. doi: 10.1016/s1357-2725(99)00028-x. Int J Biochem Cell Biol. 1999. PMID: 10467728 Review.
Cited by
-
Antagonistic effect of cyclin-dependent kinases and a calcium-dependent phosphatase on polyglutamine-expanded androgen receptor toxic gain of function.Sci Adv. 2023 Jan 6;9(1):eade1694. doi: 10.1126/sciadv.ade1694. Epub 2023 Jan 6. Sci Adv. 2023. PMID: 36608116 Free PMC article.
-
Modeling Neurodegenerative Disorders in Drosophila melanogaster.Int J Mol Sci. 2020 Apr 26;21(9):3055. doi: 10.3390/ijms21093055. Int J Mol Sci. 2020. PMID: 32357532 Free PMC article. Review.
-
Inherited C-terminal TREX1 variants disrupt homology-directed repair to cause senescence and DNA damage phenotypes in Drosophila, mice, and humans.Nat Commun. 2024 Jun 1;15(1):4696. doi: 10.1038/s41467-024-49066-7. Nat Commun. 2024. PMID: 38824133 Free PMC article.
-
Cell Cycle Re-entry in the Nervous System: From Polyploidy to Neurodegeneration.Front Cell Dev Biol. 2021 Jun 24;9:698661. doi: 10.3389/fcell.2021.698661. eCollection 2021. Front Cell Dev Biol. 2021. PMID: 34249947 Free PMC article. Review.
-
Regulation of neuronal bioenergetics as a therapeutic strategy in neurodegenerative diseases.Neural Regen Res. 2021 Aug;16(8):1467-1482. doi: 10.4103/1673-5374.303007. Neural Regen Res. 2021. PMID: 33433460 Free PMC article.
References
-
- Abraham R.T. Cell cycle checkpoint signaling through ATM and ATR kinases. Genes & Dev. 2001;15:2177–2196. - PubMed
-
- Abraham R.T. MAPKAP kinase-2: Three’s company at the G2 checkpoint. Mol. Cell. 2005;17:163–164. - PubMed
-
- Abraham R.T., Tibbetts R.S. Guiding ATM to broken DNA. Science. 2005;308:551–554. - PubMed
-
- Alterman N., Fattal-Valevski A., Moyal L., Crawford T.O., Lederman H.M., Ziv Y., Shiloh Y. Ataxia-telangiectasia: Mild neurological presentation despite null ATM mutation and severe cellular phenotype. Am. J. Med. Genet. 2007;143A:1827–1834. - PubMed
Publication types
MeSH terms
Substances
Grants and funding
LinkOut - more resources
Full Text Sources
Medical
Molecular Biology Databases
Research Materials
Miscellaneous
