. 2008 Apr 15;105(15):5821-6.
doi: 10.1073/pnas.0710533105. Epub 2008 Apr 11.

Linking functionally related genes by sensitive and quantitative characterization of genetic interaction profiles

Affiliations

Linking functionally related genes by sensitive and quantitative characterization of genetic interaction profiles

Laurence Decourty et al. Proc Natl Acad Sci U S A. .

Abstract

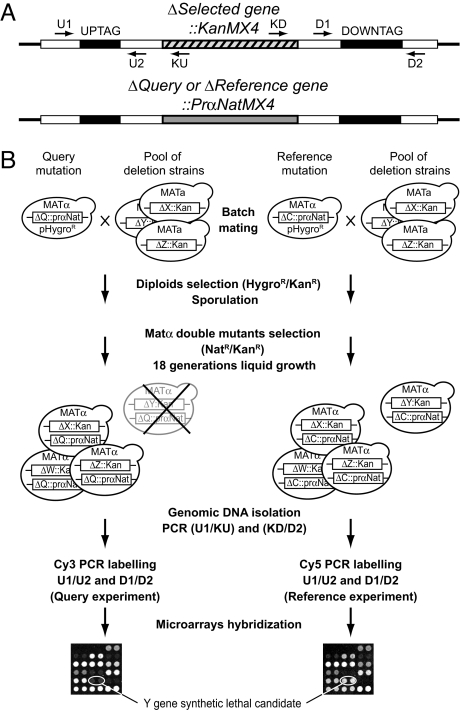
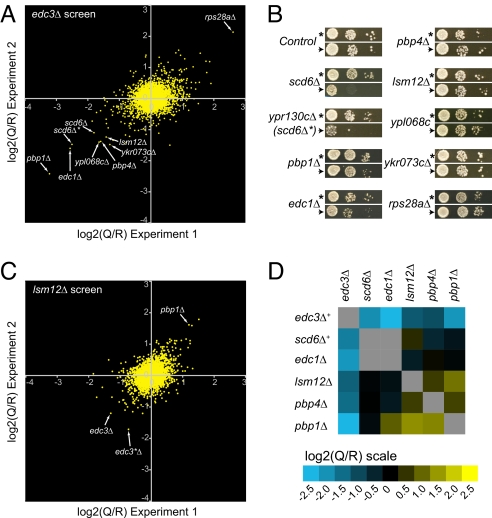
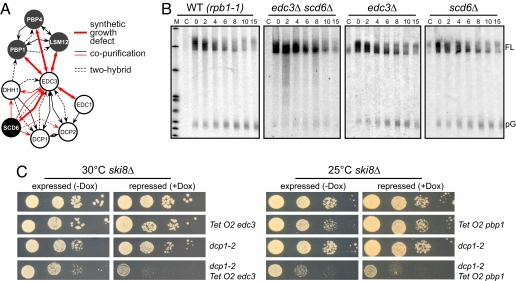
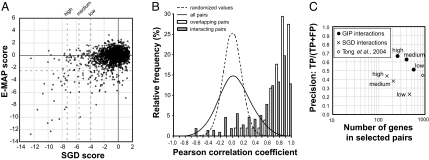
Describing at a genomic scale how mutations in different genes influence one another is essential to the understanding of how genotype correlates with phenotype and remains a major challenge in biology. Previous studies pointed out the need for accurate measurements of not only synthetic but also buffering interactions in the characterization of genetic networks and functional modules. We developed a sensitive and efficient method that allows such measurements at a genomic scale in yeast. In a pilot experiment (41 genome-wide screens), we quantified the fitness of 140,000 double deletion strains relative to the corresponding single mutants and identified many genetic interactions. In addition to synthetic growth defects (validated experimentally with factors newly identified as genetically interfering with mRNA degradation), most of the identified genetic interactions measured weak epistatic effects. These weak effects, rarely meaningful when considered individually, were crucial to defining specific signatures for many gene deletions and had a major contribution in defining clusters of functionally related genes.


Conflict of interest statement

The authors declare no conflict of interest.

Figures

Fig. 1.
Fig. 1.
The genetic interaction mapping (GIM) method. (A) The generated double-mutant haploid strains contain the resistance markers and the oligonucleotide tags for the query gene deletion and for a gene deletion from the collection. (B) Schematics of the GIM method. For every screen, two experiments are run in parallel, one with the query gene deletion strain and another with a reference deletion. Reference deletions were chosen to affect dubious ORFs, for which no significant effect on growth has been observed, either alone or in combination with any other deletion (see Fig. S1C). The query and reference deletions are tagged with a haploid-specific nourseothricin resistance marker. The strains are transformed with a plasmid that bears a hygromycin resistance cassette for diploids selection. Each of these strains is then mated with a pool of strains containing all of the viable strains from the MATa haploid gene deletion collection. The diploids are selected by using hygromycin and kanamycin resistance. Following sporulation of the heterozygous diploids, the MATα double mutant spores are selected and grown for ≈18 generations in rich liquid medium (YPD) containing nourseothricin and geneticin. Cells are collected and the tags marking the deletions of the pool are amplified by PCR and labeled with Cy3 or Cy5. Microarrays are used to measure the relative abundance of double mutants within the query versus the reference populations.
Fig. 2.
Fig. 2.
Reproducibility and sensitivity of GIM. (A) Comparison of two independent screens with edc3Δ as a query mutation and ymr326cΔ as a reference. Arrows point to the values obtained for mutants that were subsequently tested on plates. (B) Plate assays for double deletions with edc3Δ. Dilution series of sporulated cultures of double mutants obtained by combining either the query mutation edc3Δ::prMFα2NatR (arrowhead) or the control mutation ymr326cΔ::prMFα2NatR (asterisk) and the indicated deletions (“Control” represents the deletion of YEL068C, another reference). Cultures were grown at 23°C on rich medium containing geneticin and nourseothricin. The deletion of the dubious ORF YPR130C was called “scd6Δ*” because it overlaps the scd6Δ deletion and thus constitutes an independent mutation of SCD6. (C) As in A except that lsm12Δ was used as the query mutation. (D) Matrix of genetic interactions between genes whose deletions showed a synthetic growth defect with edc3Δ. The values are means of at least two independent screens. The plus sign after edc3Δ and scd6Δ indicates that the shown values were averaged from edc3Δ and yel014cΔ and from scd6Δ and ypr130cΔ, respectively.
Fig. 3.
Fig. 3.
Functional validation of novel genes identified by GIM as linked to RNA degradation. (A) Overview of biochemical and genetic interactions shared by EDC3, EDC1, SCD6, PBP1, PBP4, and LSM12. Red lines correspond to interactions uncovered during this work (Fig. 2, Table S1, Dataset S3, and Fig. S4A), whereas black lines correspond to published data compiled in the BioGRID database (24). (B) MFA2pG mRNA degradation time courses in edc3Δ, scd6Δ, or edc3Δ scd6Δ strains compared with a wild type (WT). All strains carried the temperature-sensitive RNA-pol II mutation rpb1-1 and the MFA2pG reporter mRNA under the control of a pGAL1 promoter. Cultures were grown at 25°C in raffinose medium, shifted for 1 h at 25°C in galactose medium to induce MFA2pG transcription. At time 0, the cells were transferred in glucose-containing medium at 37°C, and aliquots were taken at the indicated time points. Lane C corresponds to a noninduced culture as control. Northern blots from total RNAs separated on 5% polyacrylamide gels were probed with a radiolabeled oligo-C specific for the poly(G) of the MFA2pG mRNA. FL and pG indicate the positions of full-length mRNAs and of the polyG degradation intermediate, respectively. (C) Genetic interactions between EDC3 (Left) or PBP1 (Right) and the decapping enzyme DCP2 in a cytoplasmic exosome mutant background (ski8Δ). EDC3 and PBP1 were placed under the control of the doxycycline repressible TetO2 promoter (25) in ski8Δ or ski8Δ, dcp1-2 double mutants (10). After growth at 25°C, 10-fold dilution series of cultures at the same optical density were spotted on YPD complete medium without or with doxycycline (4 μg/ml; −Dox/+Dox) and incubated at 25°C or 30°C as indicated.
Fig. 4.
Fig. 4.
GIM provides robust, specific genetic interaction profiles that correlate with function. (A) SGD scores, centered on 0, and E-MAP scores (5) for the 1,972 pairs of deletions for which the synthetic growth defects were measured by both methods were plotted, with dotted lines indicating the arbitrarily defined strong, medium, and weak SGD scores as well as the E-MAP threshold value for significant genetic interactions. (B) To evaluate the reproducibility of genetic interaction profiles and their correlation with protein–protein interactions, we calculated the Pearson correlation coefficient for all of the possible 598,965 pairs of combinations of the 1,095 selected target gene deletions. The frequency distribution of the correlation coefficients (continuous line) was compared with the frequency distribution of a randomized set (dashed line). Subsets of pairs for known interacting proteins (21) (gray bars; “interacting pairs”) or for deletions that overlap (open bars; “overlapping pairs”) showed a highly skewed distribution with most of the values having strong positive correlation (P < 10−15; χ2 test). (C) The performance of both SGD and GIP scores in predicting functional association of genes was assessed by comparison with a Gene Ontology (GO) “gold standard” (22). To estimate both the coverage and the functional predictive value of the identified genetic interactions, we plotted, at different thresholds of the two scores, precision [number of predictions found as true in the gold standard (TP, true pairs) divided by the sum of TP and the number of predictions scored as false in the gold standard (FP)] against the number of distinct genes found in the corresponding pairs. The estimated precision and coverage of data derived from SGD scores are shown as crosses, and data derived from correlation of genetic interaction profiles (GIP scores) are shown as filled circles. Coverage and precision for data obtained in a large-scale (132 query mutations) SGA genetic screen (4) is shown by a diamond.

References

    1. Tong AH, et al. Systematic genetic analysis with ordered arrays of yeast deletion mutants. Science. 2001;294:2364–2368. - PubMed
    1. Ooi SL, Shoemaker DD, Boeke JD. DNA helicase gene interaction network defined using synthetic lethality analyzed by microarray. Nat Genet. 2003;35:277–286. - PubMed
    1. Pan X, et al. A robust toolkit for functional profiling of the yeast genome. Mol Cell. 2004;16:487–496. - PubMed
    1. Tong AH, et al. Global mapping of the yeast genetic interaction network. Science. 2004;303:808–813. - PubMed
    1. Collins SR, et al. Functional dissection of protein complexes involved in yeast chromosome biology using a genetic interaction map. Nature. 2007;446:806–810. - PubMed

Publication types

LinkOut - more resources