. 2008 Jun 13;283(24):16711-22.
doi: 10.1074/jbc.M802246200. Epub 2008 Apr 11.

Mitotic phosphorylation stimulates DNA relaxation activity of human topoisomerase I

Affiliations

Mitotic phosphorylation stimulates DNA relaxation activity of human topoisomerase I

Jennifer S Hackbarth et al. J Biol Chem. .

Abstract

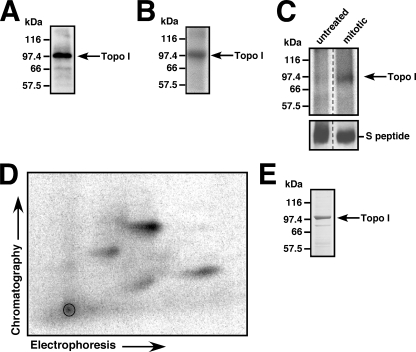
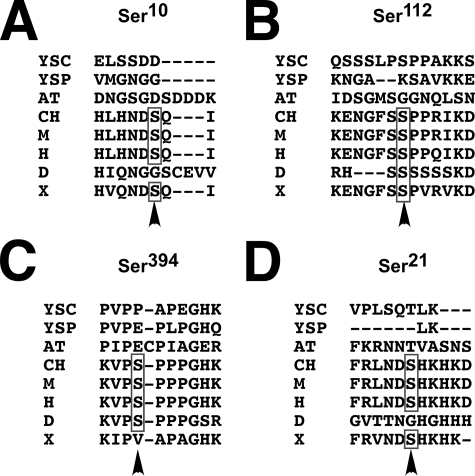
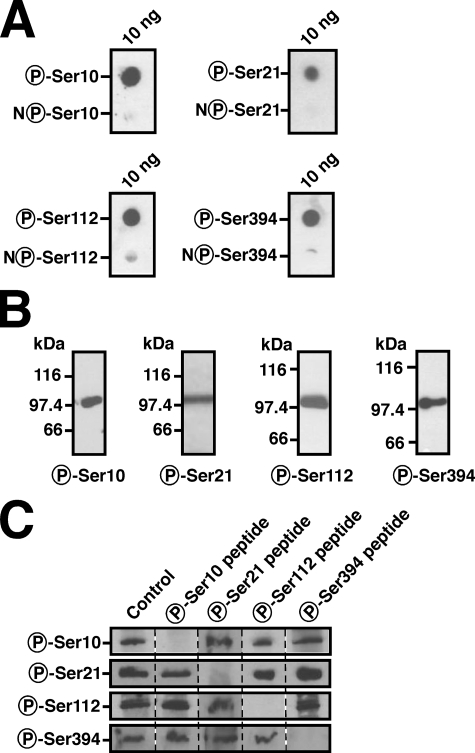
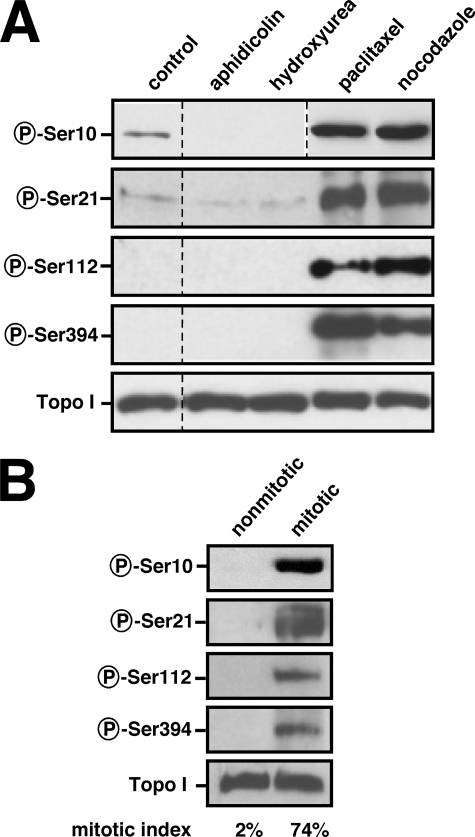
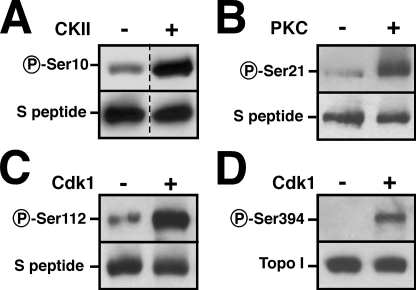
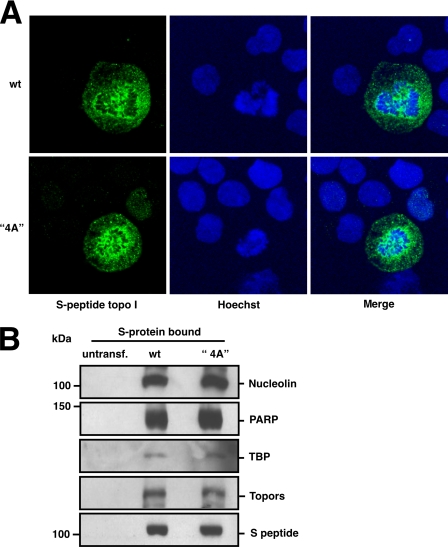
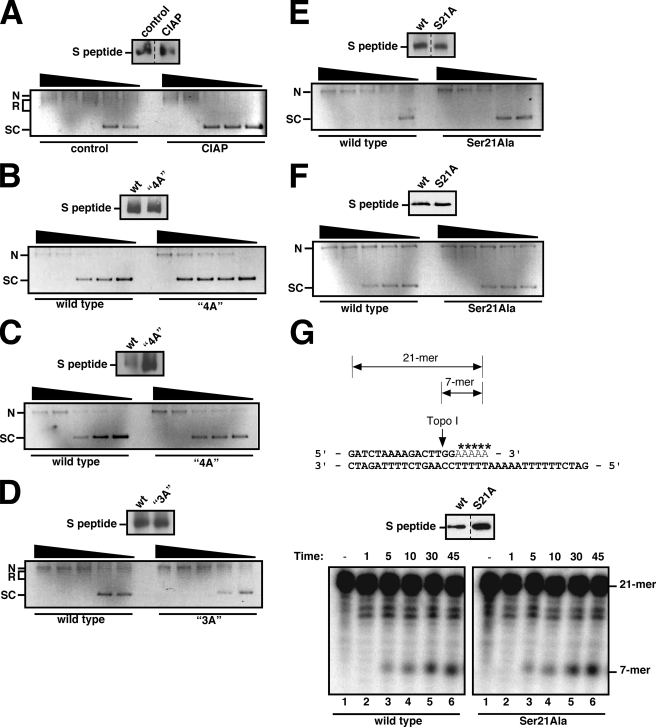
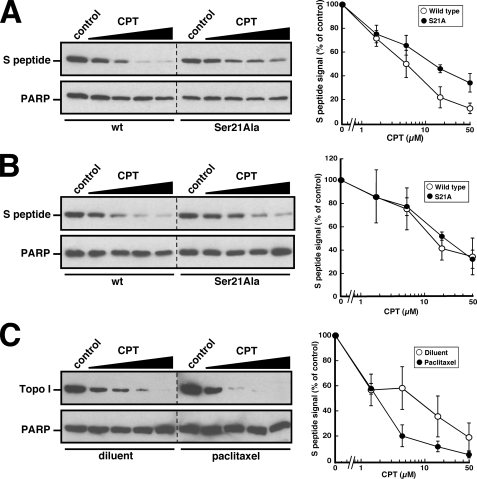
Human DNA topoisomerase I (topo I) is an essential mammalian enzyme that regulates DNA supercoiling during transcription and replication. In addition, topo I is specifically targeted by the anticancer compound camptothecin and its derivatives. Previous studies have indicated that topo I is a phosphoprotein and that phosphorylation stimulates its DNA relaxation activity. The locations of most topo I phosphorylation sites have not been identified, preventing a more detailed examination of this modification. To address this issue, mass spectrometry was used to identify four topo I residues that are phosphorylated in intact cells: Ser(10), Ser(21), Ser(112), and Ser(394). Immunoblotting using anti-phosphoepitope antibodies demonstrated that these sites are phosphorylated during mitosis. In vitro kinase assays demonstrated that Ser(10) can be phosphorylated by casein kinase II, Ser(21) can be phosphorylated by protein kinase Calpha, and Ser(112) and Ser(394) can be phosphorylated by Cdk1. When wild type topo I was pulled down from mitotic cells and dephosphorylated with alkaline phosphatase, topo I activity decreased 2-fold. Likewise, topo I polypeptide with all four phosphorylation sites mutated to alanine exhibited 2-fold lower DNA relaxation activity than wild type topo I after isolation from mitotic cells. Further mutational analysis demonstrated that Ser(21) phosphorylation was responsible for this change. Consistent with these results, wild type topo I (but not S21A topo I) exhibited increased sensitivity to camptothecin-induced trapping on DNA during mitosis. Collectively these results indicate that topo I is phosphorylated during mitosis at multiple sites, one of which enhances DNA relaxation activity in vitro and interaction with DNA in cells.


Figures

FIGURE 1.
FIGURE 1.
Endogenous and S peptide-tagged topo I is phosphorylated in cells. A, after 2.5 × 10⁷ K562 human leukemia cells were radiolabeled for 4 h with 0.25 mCi/ml [32P]orthophosphate, topo I was isolated by immunoprecipitation using human anti-topo I antiserum, subjected to SDS-PAGE, and analyzed by autoradiography. B, after 2.5 × 10⁷ K562 cells stably expressing topo I-S (Y723F) were labeled for 4 h with 0.25 mCi/ml [32P]orthophosphate, the tagged topo I was isolated on S protein-agarose beads. Samples were subjected to SDS-PAGE and analyzed by autoradiography. C, 3.0 × 10⁷ K562 cells transfected with a plasmid encoding S-topo I (Tyr723) were treated with 100 nm paclitaxel or diluent for 16 h followed by 0.25 mCi/ml [32P]orthophosphate for 4 h. Topo I was isolated on S protein-agarose beads, subjected to SDS-PAGE, and analyzed by autoradiography as well as blotting with anti-S peptide antibody (25). The panel contains lanes from a single film exposure. Dashes indicate removal of unrelated lanes. D, after metabolic labeling with [32P]orthophosphate, topo I was isolated by pulldown from 5.0 × 10⁷ paclitaxel-treated cells stably expressing topo I-S (Y723F) as described in B, subjected to SDS-PAGE, and stained with Coomassie Brilliant Blue. The excised topo I band was subjected to two-dimensional tryptic mapping and PhosphorImager analysis as described under “Experimental Procedures.” The sample origin is indicated by the circle. E, the stable line described in B was also used to obtain unlabeled, purified topo I for mass spectrometry as shown by a representative Coomassie Blue-stained gel. Results in B, C, D and E are representative of five, five, nine, and five experiments, respectively.
FIGURE 2.
FIGURE 2.
Conservation of the four mapped topo I phosphorylation sites. A–D, sequence homology of the four phosphorylation sites. SC, Saccharomyces cerevisiae; SP, Schizosaccharomyces pombe; AT, Arabidopsis thaliana; X, Xenopus; M, mouse; CH, chicken; H, human; D, Drosophila melanogaster.
FIGURE 3.
FIGURE 3.
Development of phosphotopo I antibodies. A and B, polyclonal phosphoepitope-specific antibodies for Ser10, Ser21, Ser112, and Ser394 were generated in rabbits. Bleeds were affinity-purified as described under “Experimental Procedures” and screened by dot blots using phosphorylated (P) and nonphosphorylated (NP) peptides coupled to bovine serum albumin (A) and immunoblotting using K562 lysates (B). C, specificity of the anti-phosphoepitope antibodies. Affinity-purified antibodies were incubated with a 1 μg/ml concentration of the designated phosphopeptide during incubation with nitrocellulose-immobilized mitotic K562 lysates. Each panel contains lanes from a single film exposure. Dashes indicate removal of intervening lanes.
FIGURE 4.
FIGURE 4.
Ser10, Ser21, Ser112, and Ser394 are phosphorylated during mitosis. A, K562 cells were treated for 16 h with a variety of drugs, including 10 μm aphidicolin, 2 mm hydroxyurea, 100 nm paclitaxel, or 150 nm nocodazole, to cause arrest in various phases of the cell cycle. Changes in cell cycle distribution were confirmed by flow cytometry (supplemental Fig. S2). Samples were then subjected to SDS-PAGE and immunoblotting using anti-phospho-topo I antibodies. Each panel contains lanes from a single film exposure. Dashes indicate removal of lanes from cells subjected to additional treatments that did not affect Ser10 phosphorylation. B, mitotic A549 cells were isolated by shake-off without drug treatment as described under “Experimental Procedures.” Interphase cells were isolated at the completion of the shake-off, and the mitotic index of both interphase and mitotic cells was determined by microscopic examination after Hoechst 33258 staining. Samples were subjected to SDS-PAGE and immunoblotting. Representative topo I loading control blots are shown for both panels. Results in both panels are representative of five separate experiments. P, phosphorylated.
FIGURE 5.
FIGURE 5.
In vitro kinase analysis. Examination of the sequence around the phosphorylation sites (Fig. 2, A–D) tentatively identified kinases that could phosphorylate these sites. Topo I-S was pulled down from stably transfected K562 cells (Fig. 1E) and incubated with 200 μm ATP and 10 units of purified CKII, 10 units of Cdk1, or 10 ng of purified PKCα under conditions described under “Experimental Procedures.” Alternatively purified topo I (Y723F) was incubated with 200 μm ATP and 10 units of Cdk1. At the completion of the incubation, samples were solubilized in SDS sample buffer and analyzed by immunoblotting using the anti-phospho-topo I antibodies. CKII was found to phosphorylate Ser10 (A), PKCα was found to phosphorylate Ser21 (B), and Cdk1 was found to phosphorylate Ser112 (C) and Ser394 (D) in vitro. Results are representative of five separate experiments. P, phosphorylated.
FIGURE 6.
FIGURE 6.
Mutation of the four sites does not detectably affect localization or the assayed protein-protein interactions of topo I. A, 24 h after transfection with plasmids encoding 4A or wild type (wt) S-topo I, log phase K562 cells were fixed with methanol and stained with anti-S peptide antibody followed by fluorescein-conjugated anti-mouse IgG and Hoechst 33258. Representative images of mitotic cells are shown. Note that the mitotic index is low because no spindle poisons were added. B, 6 h after transfection with plasmids encoding wild type (wt) or 4A S-topo I, K562 cells were treated for 16 h with 100 nm paclitaxel to induce mitotic arrest. Tagged S-topo I was isolated using S protein-agarose, subjected to SDS-PAGE, and analyzed by immunoblotting using antibodies that recognize known binding partners of topo I. Untransfected (untransf.) K562 cells were included as a negative control. Results are representative of three (A) or four (B) separate experiments. PARP, poly(ADP-ribose) polymerase; TBP, TATA-binding protein.
FIGURE 7.
FIGURE 7.
DNA relaxation activity of wild type topo I from interphase and mitotic cells. A, endogenous topo I was extracted from K562 cells treated with 0.1% DMSO or 100 nm paclitaxel to induce mitotic arrest as described under “Experimental Procedures.” Serial 2-fold dilutions of the extracts were subjected to immunoblotting for topo I or used in a DNA relaxation assay to examine conversion from supercoiled plasmid (SC) to relaxed forms (R). Aliquots of the most concentrated extracts (first lanes after dashed lines) contained equal amounts of topo I (inset). The “0lane contains plasmid that was incubated without extract. Dashed lines indicate removal of intervening lanes that contained unequal amounts of topo I. The graph shows substrate remaining at the end of the 30-min incubation. Error bars, mean ± S.E. of three independent experiments. B, extracts adjusted to contain equal amounts of topo I polypeptide (inset) from interphase or paclitaxel-arrested K562 cells were assayed for plasmid relaxation activity over time (lanes 2–10). Lane 1, untreated substrate. The dashed line indicates juxtaposition of two separate agarose gels from the same assay. The graph shows substrate remaining on the gel at each time point and the first order regression line. Results are representative of assays using three independently derived extracts. N, location of nicked and, in some assays, relaxed plasmid.
FIGURE 8.
FIGURE 8.
Effect of Ser21 phosphorylation on topo I activity. A, K562 cells were transiently transfected with wild type (wt) S-topo I (Tyr723) and arrested in mitosis with 100 nm paclitaxel. S protein-agarose precipitates were treated with buffer or 10 units of calf intestine alkaline phosphatase (CIAP) as described under “Experimental Procedures.” The beads were subjected to 2-fold dilutions in topo I assay buffer and used in a DNA relaxation assay. Aliquots of the immobilized topo I were also subjected to immunoblotting with anti-S peptide antibody to verify equal loading (see insets). The inset contains lanes from a single film exposure. B–E, wild type and 4A S-Topo I (B and C), wild type and 3A S-Topo I (D), or wild type and S21A S-Topo I (E) were isolated from paclitaxel-treated K562 cells and assayed as described in A. F, wild type and S21A S-Topo I were isolated from interphase K562 cells and assayed as described in A. Because of variability in transfection efficiency, experiments shown in A–F were conducted separately and cannot be directly compared. G, wild type and S21A S-Topo I isolated from paclitaxel-treated K562 cells were incubated with radiolabeled suicide substrate (inset) for the indicated length of time. *, radiolabeled nucleotide in substrate. At the completion of the reaction, the 21-mer substrate and 7-mer product were separated and visualized by phosphorimaging. Two separate gels from a single assay were imaged simultaneously. Inset, S peptide blot showing corresponding topo I contents of the pulldowns. Dashes indicate removal of extraneous lanes. Results are representative of three (A), 14 (B and C), four (D), three (E), five (F), and three (G) assays. SC, supercoiled; R, relaxed; N, location of nicked and, in some assays, relaxed plasmid.
FIGURE 9.
FIGURE 9.
The S21A topo I mutant is less sensitive to CPT-induced trapping on DNA in intact mitotic cells. K562 cells transfected with plasmids encoding wild type (wt) or S21A S-topo I (Tyr723) were treated with 100 nm paclitaxel for 16 h (A) or left untreated (B) before subjecting cells to a band depletion assay to assess CPT-induced stabilization of topo I-DNA complexes as described under “Experimental Procedures.” The blots were probed with anti-S peptide antibody to specifically detect transfected constructs. C, K562 cells were treated with 100 nm paclitaxel or diluent for 16 h and then subjected to band depletion assay. Samples were subjected to SDS-PAGE, immunoblotting with anti-topo I to detect endogenous polypeptide, and densitometry using ImageJ. Dashes indicate removal of extraneous lanes. Error bars, mean ± S.E. of three (A), three (B), and five (C) experiments, respectively. PARP, poly(ADP-ribose) polymerase.

Similar articles

Cited by

References

    1. Wang, J. C. (2002) Nat. Rev. Mol. Cell Biol. 3 430-440 - PubMed
    1. Champoux, J. J. (2001) Annu. Rev. Biochem. 70 369-413 - PubMed
    1. Champoux, J. J. (1976) Proc. Natl. Acad. Sci. U. S. A. 73 3488-3491 - PMC - PubMed
    1. Madden, K. R., and Champoux, J. J. (1992) Cancer Res. 52 525-532 - PubMed
    1. Koster, D. A., Palle, K., Bot, E. S., Bjornsti, M. A., and Dekker, N. H. (2007) Nature 448 213-217 - PubMed

Publication types