. 2008 Jul;25(7):1459-71.
doi: 10.1093/molbev/msn090. Epub 2008 Apr 11.

Smooth skyride through a rough skyline: Bayesian coalescent-based inference of population dynamics

Affiliations

Smooth skyride through a rough skyline: Bayesian coalescent-based inference of population dynamics

Vladimir N Minin et al. Mol Biol Evol. 2008 Jul.

Abstract

Kingman's coalescent process opens the door for estimation of population genetics model parameters from molecular sequences. One paramount parameter of interest is the effective population size. Temporal variation of this quantity characterizes the demographic history of a population. Because researchers are rarely able to choose a priori a deterministic model describing effective population size dynamics for data at hand, nonparametric curve-fitting methods based on multiple change-point (MCP) models have been developed. We propose an alternative to change-point modeling that exploits Gaussian Markov random fields to achieve temporal smoothing of the effective population size in a Bayesian framework. The main advantage of our approach is that, in contrast to MCP models, the explicit temporal smoothing does not require strong prior decisions. To approximate the posterior distribution of the population dynamics, we use efficient, fast mixing Markov chain Monte Carlo algorithms designed for highly structured Gaussian models. In a simulation study, we demonstrate that the proposed temporal smoothing method, named Bayesian skyride, successfully recovers "true" population size trajectories in all simulation scenarios and competes well with the MCP approaches without evoking strong prior assumptions. We apply our Bayesian skyride method to 2 real data sets. We analyze sequences of hepatitis C virus contemporaneously sampled in Egypt, reproducing all key known aspects of the viral population dynamics. Next, we estimate the demographic histories of human influenza A hemagglutinin sequences, serially sampled throughout 3 flu seasons.


Figures

F<sc>IG</sc>. 1.—
FIG. 1.—
Example of a genealogy with intercoalescent interval notation. Times of coalescence and sampling events are depicted as vertical dashed lines with numbers of lineages present at these times shown above the lines. Below the genealogy, we mark the boundaries of intercoalescent intervals together with their lengths (u2,…,u5). We show how sampling events interrupt the intercoalescent intervals and produce subintervals with lengths (w20,…,w52) at the bottom of the figure.
F<sc>IG</sc>. 2.—
FIG. 2.—
Constant population size simulation. We present a classical skyline plot (solid black line) in the top left part of the figure. The other 5 plots show posterior median (solid black line) and 95% BCIs (gray shading) of the effective population size under the ORMCP model, Bayesian skyline plot, time-aware and uniform Bayesian skyrides with a fixed genealogy, and BEAST Bayesian skyride method. In all 6 plots, the dashed lines represent the true population size trajectory that was used for simulations. Here and in all subsequent plots of effective population sizes, we use the log transformation of the population size axis.
F<sc>IG</sc>. 3.—
FIG. 3.—
Exponential growth simulation. See figure 2 for the legend explanation.
F<sc>IG</sc>. 4.—
FIG. 4.—
Simulated bottleneck. See figure 2 for the legend explanation.
F<sc>IG</sc>. 5.—
FIG. 5.—
Egyptian HCV. In the top left corner, we show the estimated genealogy of the HCV sequences. The rest of the plots demonstrate posterior medians (solid lines) and 95% BCIs (shaded gray areas) of the scaled effective population size trajectories under the BEAST Bayesian skyride (top right), unconstrained (bottom left), and constrained (bottom right) fixed-tree time-aware Bayesian skyride analyses. In the constrained model, the effective population size is forced to be constant prior to the 1920s.
F<sc>IG</sc>. 6.—
FIG. 6.—
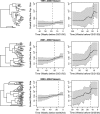
Intraseason dynamics of human influenza. For each season, we plot the estimated genealogy (left), the fixed-tree time-aware (middle) and BEAST (right) Bayesian skyride estimates. The vertical dashed lines in the middle and right columns mark 1 October in all 3 seasons.
F<sc>IG</sc>. 7.—
FIG. 7.—
Prior sensitivity. In the left plot, we depict the prior density (dashed line) and posterior histogram (vertical bars) of the log-transformed GMRF precision τ. The right plot demonstrates 5 boxplots of the posterior distributions of log τ corresponding to 5 different prior means of τ. In both plots, we use the Egyptian HCV data.

References

    1. Bernardinelli L, Clayton D, Montomoli C. Bayesian estimates of disease maps: how important are priors? Stat Med. 1995;14:2411–2431. - PubMed
    1. Biek R, Drummond A, Poss M. A virus reveals population structure and recent demographic history of its carnivore host. Science. 2006;311:538–541. - PubMed
    1. Chib S, Jeliazkov I. Marginal likelihood from the Metropolis-Hastings output. J Am Stat Assoc. 2001;96:270–281.
    1. Drummond A, Ho S, Phillips M, Rambaut A. Relaxed phylogenetics and dating with confidence. PLoS Biology. 2006;4:e88. - PMC - PubMed
    1. Drummond A, Nicholls G, Rodrigo A, Solomon W. Estimating mutation parameters, population history and genealogy simultaneously from temporally spaced sequence data. Genetics. 2002;161:1307–1320. - PMC - PubMed

Publication types